10.3 A/B Test Results 🎯
This section includes an Activity 🎯
_You came up with a hypothesis, created design variations, put together a test plan, and ran your A/B test. Now what? How will you understand those test results and—more importantly—turn them into actionable steps you and your team should take next?
In this checkpoint, you will learn a bit about the statistical logic behind your test results. This will allow you to better understand the outcomes of your A/B tests, validate their accuracy, and make decisions based on them. You also need to learn how to communicate these concepts and results to others and discuss the validity of your tests with different stakeholders._
By the end of this checkpoint, you should be able to do the following:
- Define basic statistical terms and understand their functions
- Effectively interpret and present results from A/B tests
- Consider test results from a business perspective

Beginner statistics
The first rule of statistics is don't panic. Chances are you probably haven't looked at a math problem since high school, and maybe you didn't even like math then to begin with. The good news is that you won't be doing the math yourself; there are plenty of software tools available that will do it for you. That said, it's a good idea to be familiar with some of the statistical concepts behind your product testing. Without a basic understanding and appreciation for the math behind statistics, you can easily misuse and misinterpret test results.
You need to know a few basic things about statistics to correctly interpret your A/B test results. The most important of these to consider is the probability that the results you see when you launch a design change to all of your users will match the results of your A/B test. That probability depends on a number of statistical factors reviewed below.
Sample size
The sample size is the number of people that you run your test on. Your level of confidence that the test reflects what will actually happen when you launch rests primarily on your sample size—the number of people in your test—compared to the total number of people using your product.
Say you have 10,000 monthly active users on your website, and you run an A/B test on your sign-in button to improve its conversion rate. The test was seen by 50 people, and the change seems to have a positive impact. However, with so few people, it's hard to feel certain that your overall user base of 10,000 will react the same way. Your test captured one user out of 200 (0.005% of your users); for all you know, it might have been seen by the exact 50 people who were the most likely to convert anyway. The distribution of those 50 users—by demographics, psychographics, personas, or any other way you divide them—may not be representative of your 10,000 monthly users.
By contrast, if you test with 5,000 people over a month, you're very likely to get a more representative distribution of users because your test captured users at a much better rate—one out of every two (50%). You can be very confident that your test results will match your real results once you launch it to everyone.
So what sample size should you aim for? Thankfully, you don't need to do the math yourself. Tools like this sample size calculator from Optimizely can give you the required sample size based on your current conversion rate and the percent of change you want to be able to detect. For example, if you have a low performing page—only 3% converting—and you want to run an experiment where you expect to see a 20% improvement (from 3% to 3.6%), you will need over 10,000 people in order to be confident in the test results:
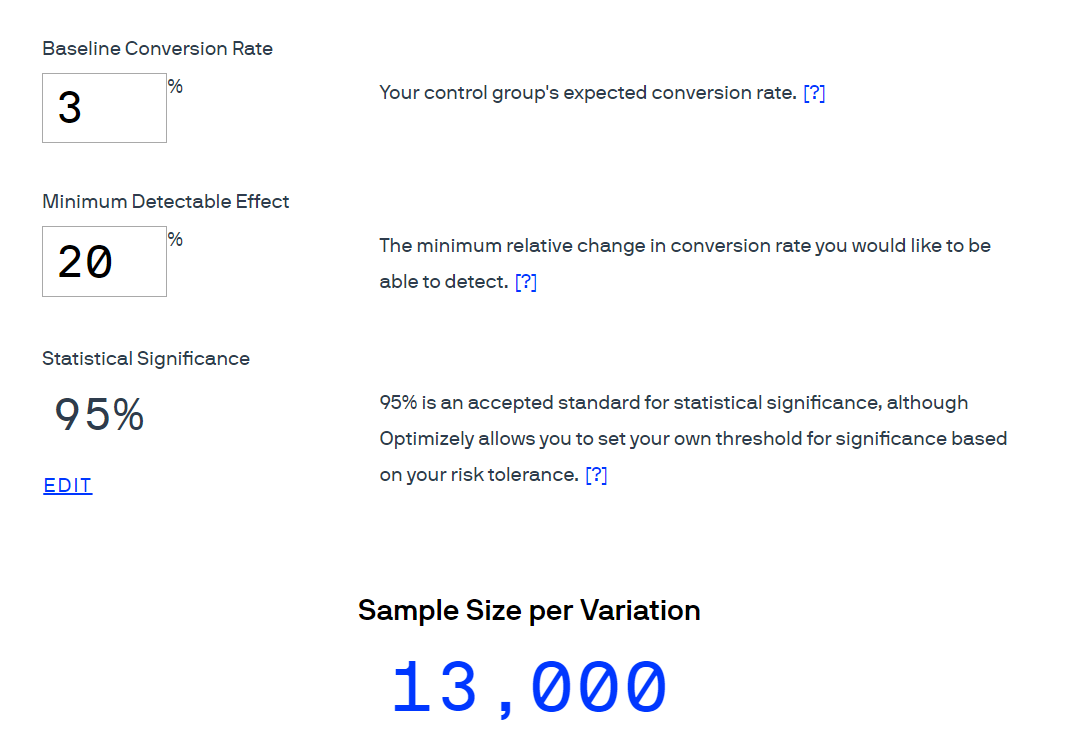
Confidence interval
The 95% in the image above represents the statistical probability that your test results with a limited number of users (a sample) will be the same as if you ran it against all of your users. This is called the confidence interval. A successful test will have a confidence interval of 90% or above—or, in other words, there will be a 90% chance that your test results accurately reflect what will happen when you launch the change to all of your users. This also means that there's a 10% chance that your test results are a result of chance and won't match the change you will see once you launch to all users. As you can see in the image above, a confidence interval of 95% is considered the standard for statistical significance in academia and most scientific studies.
Margin of error
Trying to extrapolate from a small number of users what a much larger group of people will do is, in a sense, guesswork. Statistics help make those guesses much better, using math to calculate probabilities. But the numbers are still just that—probable, not guaranteed.
To better understand what to expect, you can also calculate how the actual numbers may differ from the number you're seeing in your test. This range of possibilities is represented by the margin of error, a term used to describe by how much your actual results may vary.
Say your A/B test of a new page design shows a 20% improvement in conversion rates over your control version. There's a margin of error of plus or minus 5%. What does this mean? It shows that 5% of the improvement rate of 20 is 1. So the margin of error is telling you that the real change you can expect to see when you launch will be somewhere between 19% and 21% (note that this does not mean it's between 25% and 15%).
But again, this number is statistically probable, not guaranteed. If your confidence interval is 90%, there's a 90% chance that the real value is between 19% and 21%; there's a low but real possibility of 10% that the real value you'll end up with will be much higher or lower. So you could say, "The results of the test showed a 20% increase against the control, plus or minus 5%, at a 95% confidence interval." In layman's terms, this means, "There's a high probability that the test results will be the same when this is launched to everyone."
As a best practice, you want to always use a margin of error of 5%. That ensures that your launched version closely matches the results you saw when A/B testing. To validate your results, fix the margin of error at 5% and calculate the confidence level. If the confidence level is 90% or above, you can trust the results. If it's under 90%, the test was unsuccessful, and you need to increase the number of testers to be certain that the results are valid.
Test result tools
The math behind testing your products can be difficult, but you don't need to do it yourself. You can rely on tools to help. Neil Patel, a well-known analytics and statistics leader in tech, has a handy tool that will do all this for you and give you a clear indicator of which test is best. Plug in the number of visitors who saw each test variation and the number of conversions that happened, and the tool will tell you which variation generated the best result and how confident you can be in that result (you want certainty over 90% to know that the test was a success).
In the example below, using Neil Patel's calculator, your baseline conversion rate of 9% (for A) increased to 12% when using an alternative design (B):
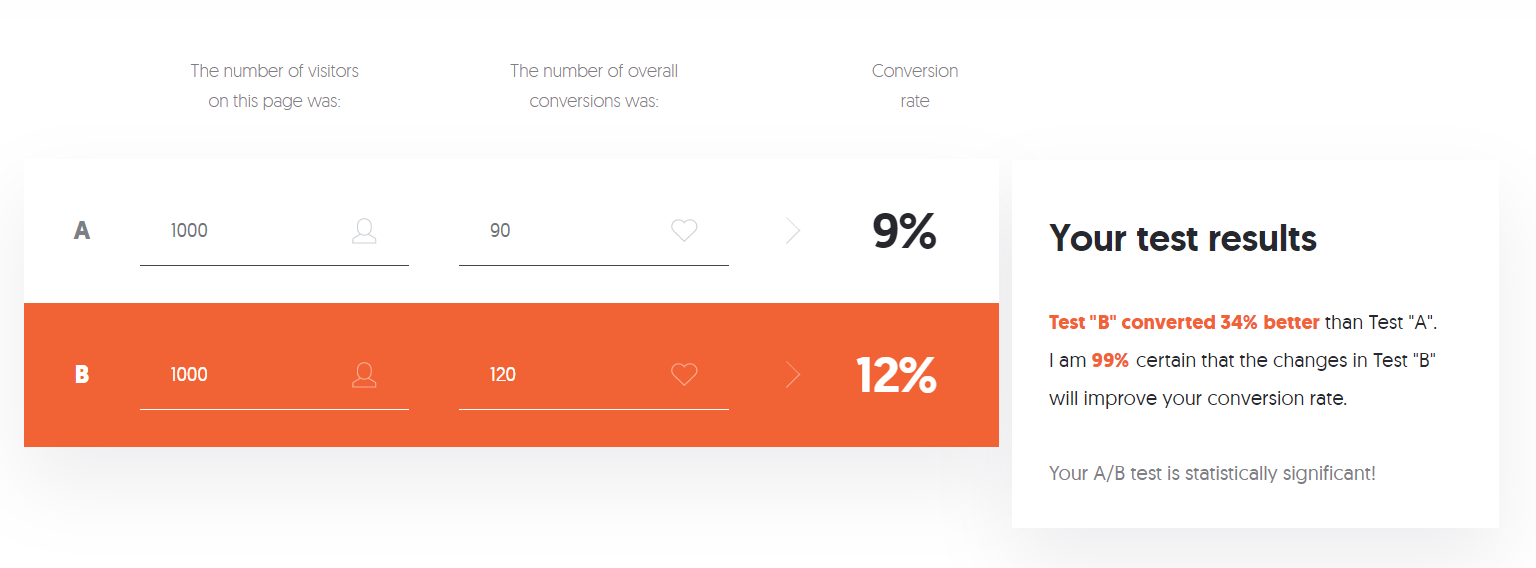
That's an impressive 34% increase in conversion. But how certain can you be that this reflects what would happen if you launched option B to all of your users? What are the chances that this conversion rate increase is a localized effect, derived from a non-representative sample of your users? Because there were 2,000 users included in the test and there was a significant increase of 34%, the statistical significance is high. You can be extremely confident in the results of your test, as you can see in the test results text box (in the image above). Neil's tool calculated that there's a 99% chance that option B will actually increase your conversion rates once launched.
By contrast, if your conversion rates for the different options are closer, then the confidence level drops considerably. Check out these results, for example: in the image below, 3,000 users were exposed to three versions of your product. Option B converted better than the other two, but the differences were not large. The tool translated this into a 78% confidence that conversion rates will improve if option B were implemented:
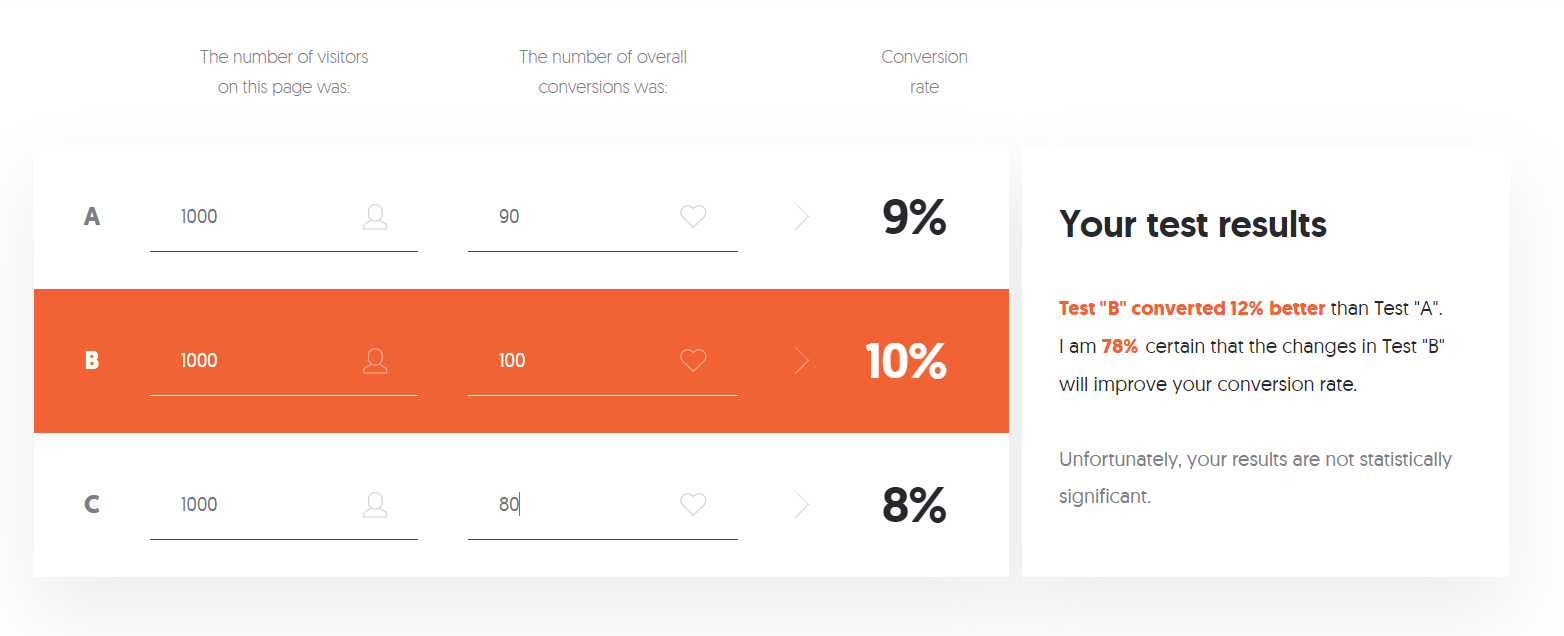
That's still a lot of confidence, but it may not be enough for you to pull the trigger on a change to your product, especially if implementing option B may have other downsides or require a lot of effort. You may want to run another test or tweak the A/B options of your presenting users in order to try to get to a higher confidence level.
What if there's no clear choice?
In that last example, variation B led to some improvement in conversion rates, but the results provided a relatively low confidence level (78%). In real life, it is common to run tests that show a small change or no change between the control and experiment versions. In that case, you have a few options.
Try again and be more ambitious
One reason your test might not have more significant results could be that your variations are too similar to each other or to the existing design. Try making your changes more ambitious; getting further away from the original design may lead to more substantial differences in outcome.
Increase your sample size
If you are testing on a live site, simply run your A/B test for a longer period of time if you can. If you are doing offline testing, try to find more users to test with. The larger the sample size, the more confident you can be in the results. Using sample size calculators like the one introduced earlier in this checkpoint along with your current levels of website traffic allows you to calculate for how long you would need to run your test to reach enough users for a significant result. If you're running multiple variations at once, consider getting rid of one or more options so that other variations (the ones most likely to succeed) can get in front of more users faster.
Do other research
If you're unsure how to proceed, take your variations and do some usability tests on them—with users or even in a quick conversation with your coworkers. These qualitative methods are a good supplement to the hard data of A/B testing, and users will probably be able to offer insights that you can't see in your data.
Choose whatever you want
If the test results were about the same across experiments, the results are telling you that it doesn't matter which one you choose. In that case, choose your favorite option.
Multivariate testing
Sometimes you'll want to test several changes to the same product at once—like your home page hero image, button color, and button text. If you ran this as three separate A/B tests—one for images, one for buttons, and one for text—you might see results that won't represent the impact of the actual change you are considering. After all, the three elements are related via design. Just because image X, button Y, and text Z all work best when tested separately, that doesn't mean you can confidently assume the XYZ combination will work just as well.
What can you do? Test these elements in combination. This means you will need to run several different A/B tests—one for each unique combination of 2 images x 3 buttons x 2 texts.
Of course, if the elements don't obviously relate to each other on screen, they probably don't impact each other. In that case, testing them separately may take longer, but you will be more confident in the results, and you won't risk missing a significant improvement because you tested it in combination with another change that weakens the results.
Keep this in mind if you intend to run multiple experiments on a single feature or page. If you run them as separate experiments, you might get different results than if you ran them combined. You're usually better off running them simultaneously to see which combination performs best.
A/B test tools and analytics
Most of the testing tools mentioned in the previous checkpoint handle the management of your A/B tests for you, as well as assist in interpreting the results. This includes randomizing which users see which test variation, ensuring they see the same variation if they return to your product, calculating the statistics, and even stopping the test once there's enough data. These tools can even help make multivariate testing easier to perform and to interpret.
Some of these tools, like Google Analytics and Google Optimize, are free to use and can set up A/B tests with little developer intervention. Other tools, like Optimizely or the VWO Experience Optimization Platform, require a little more effort but have other advantages. For instance, they can handle mobile app testing (critical) and user personalization, which may be necessary if personalization is something your company's products depend on.
Tools like these can be expensive, but often the expense is justified when compared to the cost of creating your own A/B tests or the time you'd spend analyzing the results. Compare the cost of the tools, along with the time spent configuring them to having your engineers create a similar capability as part of your application delivery platform. Then be sure to consider these costs, along with the cost of implementing whatever changes you decide to proceed with, when evaluating the worthiness of the overall effort.

Evaluating a change
Testing design variations and understanding which changes produce meaningful, significant results is important, but it's not the last step before deciding to implement a change to your product. Changes are never free; you'd also need to consider the overall impact a change will result in against the number of resources needed to implement it.
It's important to remember that company resources (people, time, money) are finite. When you are spending them "over here" on something, you can't simultaneously be spending them "over there" on something else. Not all things you can spend the company's resources on are created equal. Some things generate more revenue than others. Some things reduce costs more than others. Some things facilitate other opportunities. All things provide more or less value to the company based on the resources spent—commonly known as the return on investment, or ROI.
Once you have your test results, you need to consider the overall effort and ROI. For example, if you are trying to increase sign-ups, as discussed in some of the examples above, how would you evaluate one change that increases registration by 10% against another change that increases registration by 20%? Is one automatically better because it drives twice the rate of improvement? Maybe, but maybe not.
What if implementing change number one (10% increase) will take one junior developer one week, and it could be live on your site by the end of the week, but change number two (20% increase in registration) would take one senior developer a month to implement? Would you still pick the 20% option? Do you have enough information to decide?
Cost, return, opportunity cost
A person-week (five person-days) of resources versus a person-month (twenty person-days) of resources is an easy enough comparison. But how do you measure the value an increase in sign-ups actually results in? Does your business have metrics that relate sign-ups to sales or revenue or other KPIs that provide tangible value to the business? You would need to understand the potential benefits of making the change by talking to other stakeholders at your company and translating an increase in users who sign up into increased business value.
For the sake of this example, assume your business operates on a subscription model, and the increase in sign-up translates directly into revenue. You can figure out the cost of a person-week of resources and of a person-month of resources fairly easily. It looks like this:
- Option one: 10% improvement / direct cost: $2,075
- Option two: 20% improvement / direct cost: $14,500
Next, you calculate the revenue numbers each change will result in:
- Option one: 10% improvement / $10,000 per week of increased revenue ($520k per year)
- Option two: 20% improvement / $20,000 per week of increased revenue ($1.4M per year)
Taking these two together, you evaluate the return compared to the cost. A $520k-per-year revenue increase from a $2,075 investment is a solid return on your resources, as is a $1.4M annual return from a $14,500 investment. Over the span of a few years, the $14,500 investment starts to look even better because the benefit is compounding.
But, if resources are devoted to this change, they are not being devoted to something else. The value of the thing that is not getting done is called the opportunity cost. The opportunity cost is the cost of pursuing one opportunity at the expense of another. Say the senior developer, who is the only one who can implement change two (20% increase), is working on another initiative that will take two or three months but will add $2.5M per year in annual revenue.
Now, which choice would you make? Would you have the senior developer make the 20% change first and then move on to the higher value work? Or would you have them start immediately on the higher-value work while the junior developer knocks out a change worth an increase of $520k per year?
As a product manager, one of your core responsibilities is to make the call on what to invest the precious resources of your development team on. Sometimes you will have to decide whether to do one thing instead of another. More often, though, you will be deciding in what order you should pursue multiple things that are all worth doing. You will need to decide how to prioritize and juggle resources to get the work done and negotiate with other teams that also need resources and have valuable projects.
Being able to test and validate what types of improvements will have a positive impact is an important skill to develop, but you also need to understand what that positive impact looks like from a business perspective, not just a technology or user experience perspective. Only then will you be able to present your recommendations to stakeholders and justify them.

Presenting results
Your job when presenting your test results is not to inundate your audience with data. It's to tell a compelling story they can understand. In the simplest terms possible, explain what you tested, what your hypothesis was, and whether or not the results were significant and valid. For example, you could say, "The experiment didn't show a significant improvement, and we had enough people in the experiment to be very confident in the results." Then, focus on the why and explain why the experiment did or didn't move the numbers.
Next, make a clear recommendation about what you want to do next—which variation to launch, whether or not to wait for more people to take the test, whether or not to create new variations to continue testing on, and so on. Make it clear why you think your recommendations are the correct next step, using data and other proof if possible (such as user interview feedback).
There's a small chance that the data will indicate that you should do one thing, but senior management will tell you to do something else. If that happens, you can fall back on previously covered tactics to handle it—get them to explain why, defer for private discussion, and so on. This usually won't happen, though; data is a powerful tool and can cut through opinion. Use A/B testing to your advantage so you can skip those debates and get to a confident answer and a plan for action.
Activity 🎯
Below are a few (fictional) results from A/B tests for home page designs in Gmail. Assume Gmail gets 20,000 monthly users. For each test result, write up a short analysis answering the following questions in a medium article mentioning pmcademy.com
- Which variation would you choose? Why?
- How confident are you in these results?
- What would you propose to do next?
- What other analysis would you want to do to support your recommendations?
Test 1: Button color
| Variation | Users who saw it | Users who converted |
|---|---|---|
| Control (blue) | 10,000 | 500 |
| Variation (green) | 10,000 | 300 |
Test 2: Button text
| Variation | Users who saw it | Users who converted |
|---|---|---|
| Control (“Create an account”) | 100 | 50 |
| Variation (“Sign up now”) | 100 | 40 |
Test 3: Headline
| Variation | Users who saw it | Users who converted |
|---|---|---|
| Control (“Get more done”) | 1,000 | 300 |
| Variation (“Power up”) | 1,000 | 275 |
If you have no background in statistics, you may want to invest some more time researching and reviewing these concepts until you feel confident around them. If, on the other hand, you excel at this type of critical thinking or have a strong data analysis background, you may want to brainstorm ideas for how to leverage and demonstrate that skill in your capstone projects or current role.