5.2 Funnels 🎯
This section includes an Activity 🎯
Now that you've mastered user flows, it's time to dive deeper into the user experience and think about your funnel. The funnel is a widely used concept that explains, visualizes, and helps you analyze your user flow and—importantly—where users are abandoning it. Understanding this concept is a critical step to becoming an effective PM.
By the end of this checkpoint, you should be able to do the following:
- Conduct a customer funnel analysis
What is a funnel?
Like a physical funnel that is wide at the top and narrow at the bottom, the concept of a funnel is used in business to describe the flow of users toward an end goal. For example, if you run an e-commerce product, you'll track the funnel of potential customers all the way from the search results and ad views that bring them onto your website up until their final step of making a purchase.
As you can imagine, more people will see an ad for your website than will click it, and more people will click it than will eventually make a purchase. In other words, the closer you are to the end of the funnel, the narrower it becomes to include fewer people.
In web and mobile products, users can be tracked in incredible detail down to the page or even the part of a page where users gave up. This lets product managers identify what part of the product or experience might have led users to abandon the flow. You can then work with design, engineering, and marketing teams to improve the flow. If successful, the flow's abandonment rate goes down, and conversion rate goes up.
Funnels also provide a useful way to visualize the user flow. For instance, take a look the Zappos example from the previous checkpoint. Assume 50% of users abandon the flow at each step of the process, and the conversion rate—or percentage of people visiting the site who actually end up buying shoes—is about 3%. You can visualize it like this:

This is a conversion funnel, and it makes it visually clear how each step in the flow affects the conversion rates. Each segment in the funnel represents a page or step that users have to go through to purchase a product.
Clear differences between sections of the funnel indicate a good place to start for deeper analysis to understand why those conversion rates are so low on those sections. Imagine that the conversion rates vary from step to step like this:
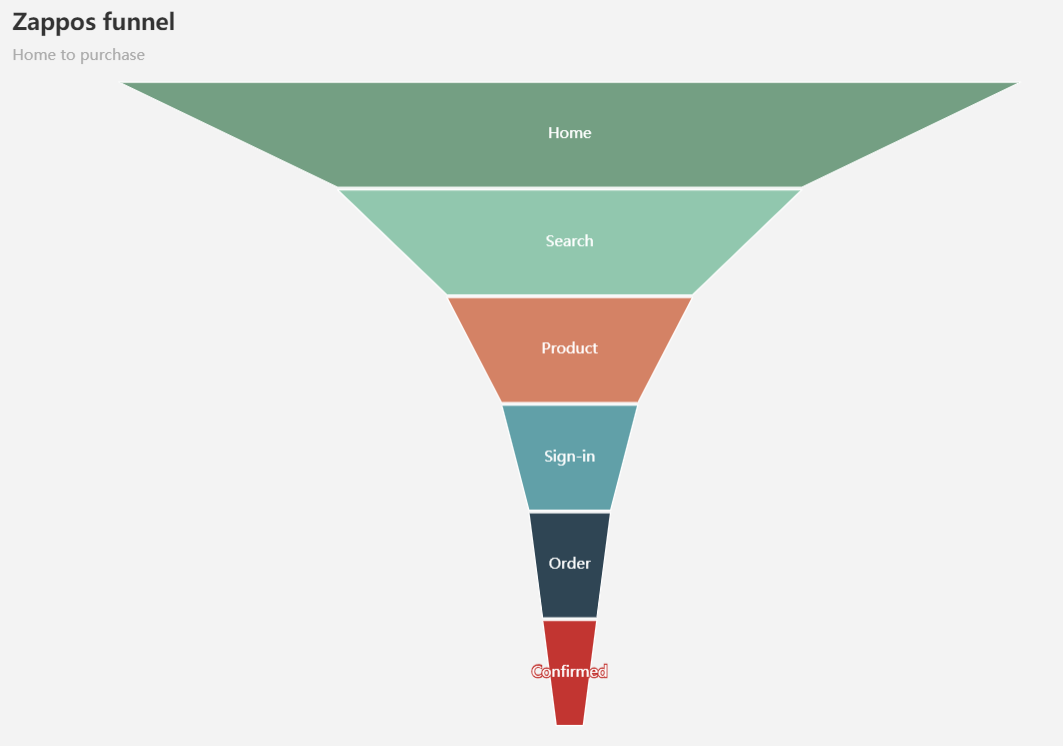
From this diagram, it's clear that the top two steps of the funnel are the ones where you lose the largest percentage of users. This is called falling out of the funnel, and it tells you that something caused users to give up. Maybe they couldn't find the shoes they wanted. Maybe they got interrupted by a coworker and couldn't finish their shopping at that moment. Regardless, they didn't reach the end goal.
Check out the video below for more information on how you can use product funnels, also called customer funnels or sales funnels, to improve your conversion rate.
Improving your funnel
As a product manager, you would need to improve the funnel for your product in order to decrease abandonment and increase conversion. If you have limited time and resources, which part of the funnel should you focus your efforts on?
Assume, for example, that 20,000 people visit your site on a daily basis. The table below describes your existing conversion rates.
| Home page | Search page | Product page | Sign-in page | Confirm order | Purchase complete | |
| Site visitors | 20,000 | 10,000 | 2,000 | 600 | 300 | 225 |
| Conversion rate | 50% | 20% | 30% | 50% | 75% |
You can see, for instance, that of the 2,000 people who make it to your product page, 30% are converted—meaning 600 users continue down your funnel to the sign-in page. The number at the end, 225, represents the number of users who ended up completing a purchase.
If you could improve any of these conversion rates by 10% (as in from 40% to 50%), which rate would have the biggest impact on the overall conversion?
| Home page | Search page | Product page | Sign-in page | Confirm order | Purchase complete | |
| Site visitors | 20,000 | 12,000 | 2,400 | 720 | 360 | 270 |
| Conversion rate | 60% | 20% | 30% | 50% | 75% | |
| Site visitors | 20,000 | 10,000 | 3,000 | 900 | 450 | 338 |
| Conversion rate | 50% | 30% | 30% | 50% | 75% | |
| Site visitors | 20,000 | 10,000 | 2,000 | 800 | 400 | 300 |
| Conversion rate | 50% | 20% | 40% | 50% | 75% | |
| Site visitors | 20,000 | 10,000 | 2,000 | 600 | 360 | 270 |
| Conversion rate | 50% | 20% | 30% | 60% | 75% | |
| Site visitors | 20,000 | 10,000 | 2,000 | 600 | 300 | 255 |
| Conversion rate | 50% | 20% | 30% | 50% | 85% |
As you can see from this example, the biggest uptake in sales would come from improving the page with the lowest conversion rate. This is usually the case, although it also depends on the numbers at play and on how consistent or inconsistent the drop-off is at each step in the process. You should always model all the possible scenarios to confirm your assumptions.
Funnel segmentation
Funnels seem pretty simple so far, right? As with everything else, it gets a lot more complicated once you consider all the variables that can impact conversion rates. For instance, imagine two kinds of users that may have ended up on Zappo's e-commerce website:
- User A searched Google for "running shoes" and clicked a Zappos Google ad
- User B typed "zappos.com" directly into the address bar of their web browser
While both went on to search for shoes on Zappos' website, it is fair to assume they will have different conversion rates. The person who went directly to a particular company's site is probably aware of that company's products and brands. This person had the specific intention to check out this site. They are much more likely to end up making a purchase than the casual visitor who may be hearing of that company for the first time.
Mixing these two together into one conversion funnel could be misleading. If group B converts twice as well as group A, the combined stats will hide group A's true conversion rate. You may also want to know exactly what the conversion rates were for visitors who were brought to your website via a Google ad in order to calculate the return on investment for your ad spend.
For this reason, you will segment your users into groups and evaluate their conversion rates in context. A common way to segment funnels is according to the source from which users arrived at your site—advertisement, organic traffic (they clicked on a non-ad search result), direct (they typed it into the address bar of their browser), clicking a link in an email, etc.
When you segment data, you'll see a lot more nuance in the conversion rates. For example, take a look at some (fake) Zappos data segmented by the source of traffic:
| Source of traffic: | Home page | Search page | Product page | Sign-in page | Confirm order | Purchase complete | |
| Google Search ads | Site visitors | 20,000 | 10,000 | 2,000 | 600 | 300 | 225 |
| Conversion rate | 50% | 20% | 30% | 50% | 75% | ||
| Organic | Site visitors | 20,000 | 10,000 | 2,000 | 2,00 | 180 | 162 |
| Conversion rate | 50% | 20% | 10% | 90% | 90% | ||
| Direct | Site visitors | 20,000 | 6,000 | 1,200 | 480 | 336 | 252 |
| Conversion rate | 30% | 20% | 40% | 70% | 75% |
It's pretty clear that the direct traffic converts best based on the raw numbers. But it's also interesting to note that the organic traffic has a much higher conversion rate at the final stages of the funnel compared to the other groups. Why might that happen? Maybe these people were searching for a specific item, found that item, and bought it. And other people who were doing more generic searches converted at the normal rate. It's worth investigating further. You can keep segmenting your users based on their searches to try to understand the trends you're seeing.
You can segment funnels in many different ways to understand how sub-groups of users are converting. Here are some examples:
- By device—mobile, tablet, or desktop
- By platform—Windows, macOS, iOS, or Android
- By demographics—location, age, etc. (as long as you have a way of capturing it)
- By type of customer—such as free or paid
- By average order value
- By lifetime order value
Some of these segments will provide insights that you can take action on. Others may be interesting but don't provide real value for your decision-making process. Consider your segmentation carefully—it can be as useful as it can be misleading. You will dive deeper into critically analyzing the data you collect about your users in future lessons.
E-commerce and beyond
For some industries, funnels are particularly important. In e-commerce, if someone doesn't make it all the way down your funnel, you don't make a sale. So if a particular step in your sales funnel is converting below expectations, or if there's a sudden drop in conversion rates across the funnel, you as the PM would be quick to investigate the cause and get to work on improving that flow right away.
That said, user abandonment doesn't necessarily indicate that there's a problem with the website design. Perhaps the users who abandoned the flow just didn't like the products you're selling. Or maybe they just got distracted and never came back to finish the purchase.
Conversion rate funnels for particular websites are not public information, but it is usually estimated that e-commerce websites convert visitors into shoppers at about 3%. Conversion rates for each industry and type of product are different. If, as a PM, you end up in a company that sees conversion rates as an important KPI, make sure you're aware of your industry's standards and your product's past performance and set reasonable improvement goals.
But what if you work in a different type of company? What would funnels mean to your role as a PM if you were to work for an activity-based software or service, such as Adobe's Photoshop software or Salesforce's customer-relationship management tool?
With these types of products, your users can't abandon the task even if there's a flaw in the flow that is supposed to lead them to it. A professional photographer using Photoshop won't decide to not finish editing an image just because a certain step of the editing process is frustrating. A salesperson using Salesforce at work can't avoid creating or updating a customer record, even if the software design makes it difficult.
In these cases, a bad flow will result not in funnel abandonment but in users getting frustrated with your software. If the problem is bad enough, you may lose customers to your competition, which could be a lot more costly for the business than losing the sale of a single pair of shoes.
That said, businesses—and PMs—often need to make tough decisions about whether to invest their limited resources in improving a product's sales funnel to get more customers or in fixing a problem with their product that is frustrating their existing customers.
It is the PM's role to understand how users experience their product's user flows and funnels and how these can be improved. Getting feedback from customers and users will allow you to continually optimize the user experience and improve the funnel conversion metrics or overall use-value of your product.
Activity 🎯
You are a PM for a membership-based professional community. Your website's home page includes a link to the "Support the Community" page, where they are invited to sign up and subscribe for a monthly membership.
You inspect your funnel information from the last quarter (3 months) by source of traffic, and it is as follows:
| Source of traffic: | Home page | Support page | Sign-up form | Credit card information | Submit payment | Membership complete | |
| Organic search | Visitors | 50,000 | 10,000 | 200 | 10 | 3 | 2 |
| Conversion rate | 20% | 2% | 5% | 28% | 65% | ||
| Search ad | Visitors | 5,000 | 2,500 | 250 | 25 | 6 | 2 |
| Conversion rate | 50% | 10% | 10% | 24% | 30% | ||
| Email marketing | Visitors | n/a | 3,000 | 300 | 90 | 45 | 28 |
| Conversion rate | 10% | 30% | 50% | 62% | |||
| Member referrals | Visitors | n/a | 375 | 281 | 140 | 91 | 82 |
| Conversion rate | 75% | 50% | 65% | 90% |
One of your main KPIs for the next quarter is to increase paid memberships by 15%. You are working with your marketing and design team to figure out the best way to achieve this goal.
In your notebook or another shareable document, come up with your recommendations by answering the following questions:
- How is your funnel working for each type of source of traffic?
- Should you invest more in the top of the funnel, for instance, by investing in an ad campaign to increase the number of total visitors? Should you do more email marketing?
- Should you focus on other parts of your funnel, for instance, by improving the copy on the "Support the Community" page that describes the benefits of a paid membership?
- Should you focus on improving the payment screen itself for clarity and ease of use?
Remember—you have limited resources and are looking for the best return on investment. You may only choose to focus on one part of your funnel. Which one will it be? Why?
Explain your recommendations—either in writing or by recording and sharing a short video as if you are explaining it to stakeholders in a meeting (recommended). Be sure to explain your thinking and reasoning. How did you reach these recommendations? What else would you want to know before making a decision, and how would you go about getting that information?