2.5 Presenting Your Research 🎯
This section includes an Activity 🎯
Presenting in front of people comes naturally to some and is incredibly challenging to others. You might be quite comfortable public speaking about hobbies or other passions, but you get nervous when it's something professional, the group is large, or you fear a project you've worked incredibly hard on may not be well received.
The previous checkpoint focused on knowing your audience and crafting an effective outline for your presentation. This checkpoint will delve into the next two steps: designing effective slides and visuals and delivering an engaging, informative presentation.
By the end of this checkpoint, you should be able to do the following:
- Design effective slides
Packaging presentation content
You created an outline that effectively communicates your objective in a way that is appropriate and relevant. If your presentation were a meal, you could say it's now cooked and full of nutrients. Now, it's time to make it look good so that your audience will be willing to taste it. No matter how insightful your message is, if your presentation isn't interesting and pleasant to look at, you'll have a hard time getting people to pay attention.
You'll remember the steps to making a presentation from the last checkpoint included the following:
- Determine an objective
- Establish an outline
- Design slides
- Practice, practice, practice
- Deliver it
Let's pick up where we left off.
Step 3: Design slides
When a presentation's slides are boring or confusing, you are contributing to the factors likely to distract your audience away from your message. On the other hand, effective visuals can help you engage your audience, demonstrate your story, and cement your message. Here are a few principles to consider as you work on your slide's design:
Less is more
It's tempting to put your outline as bullet points on a slide, then read each one as you take the audience through it. However, this is a recipe for a boring, ineffective presentation; if your audience is busy reading off your slides, they are not listening to what you have to say.
Instead, think of each slide as a sentence in a story, or better yet—a page in a picture book. It should act as visual reinforcement, but the story you are telling is much bigger than the words on the slide. In the best presentation, slides are graphic stories that help evoke the emotion or experience you're aiming for.
In general, do less. After you initially map out the slides, challenge yourself to cut the number of slides in half. Clarify the message in each slide to include no more than a single thought, and reduce its complexity. A commonly cited rule of thumb is to use no more than six words on each slide.
To see this in action, examine the two sample slides below:

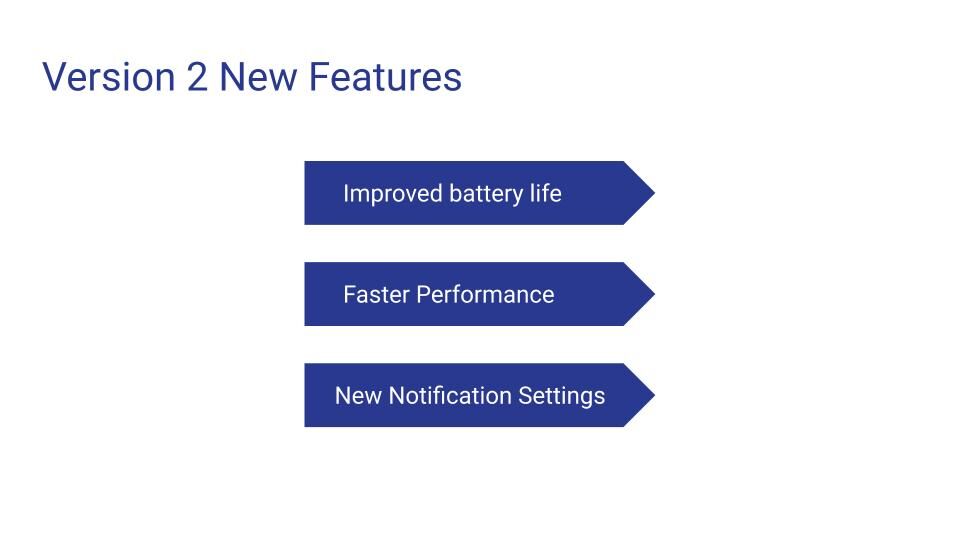
For each design option, ask yourself the following questions:
- How effective is it?
- Is it helping the audience understand your message better?
- Is it distracting the audience from what you are saying?
- Is it reducing complexity?
- Can the audience process what the slide is communicating quickly?
As you brainstorm visuals and design your own slides, use the same set of questions to assess them. If you're tempted to go into more detail or have lots of ideas for great tables and graphs, go ahead and draft them out. Several may synthesize into one simple and powerful graphic. As you start practicing your delivery, you'll soon realize which ones aren't strengthening your message. Some visuals may be saved for an appendix in case someone asks for more detail. Most of the time, you'll discover that you didn't really need those extra slides.
Images over words
How can you use slides to keep your audience engaged and focus their attention on your most important points? By using images and visualizations. Images could include photos of people or your product, related icons, diagrams, or graphs.
Always consider the audience when deciding on image type and desired quality. If it's an internal report of findings, photos from user interviews taken with your phone (and the user's approval) could be a great way to bring the audience into the experience. But these wouldn't be appropriate for a presentation to the media. High quality stock photos might be effective in some cases, but could be distractingly generic in others. Images of your product should always be clear and show something relevant to what you're verbally presenting.
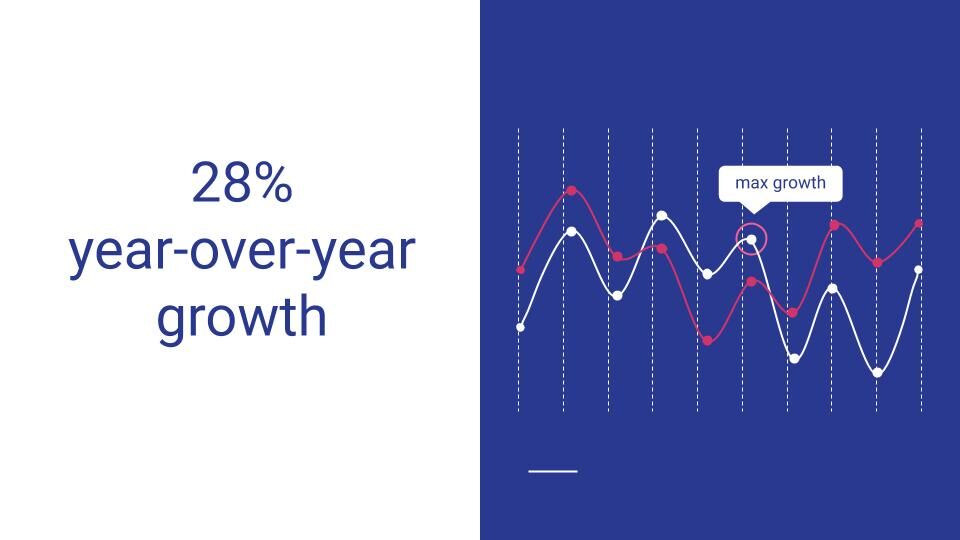
Consider the sample slide below. Compare it to the image-less slide with identical content you looked at earlier in this checkpoint. What does the image add? Which of the three content points is it drawing attention to? How will it impact audience engagement?

Graphs and diagrams are great tools for visually presenting workflows or relationships between data. But like all powerful tools, they can be used for good or evil. Unnecessary details can cause more harm than good. Avoid cluttered diagrams or graphs, and stick to high-level, easy-to-understand diagrams with few steps. Don't show data for the sake of showing the data. Show data to demonstrate and validate the story you are telling.
Context over information
Your slides are not a script or your notes. If you're presenting data or other detailed information, it is tempting to throw it on a slide and read it out to your audience. After all, you've spent much time and effort on this work and have loads of fascinating tidbits to share. Restrain yourself. Go back to the message and objective for your audience. What is the story you're telling them? What data best communicates it? Better to say less and be heard than share every detail and end up with a confused—or worse—disinterested audience.
Any text on your slides should be scannable. Your audience should be able to absorb it quickly and return their full attention to you. One way to do this is to give your slides titles that summarize the takeaways, not just present the facts.

For example, if you're presenting a table of growth over time, a generic headline would be "2018-19 Growth Data." But this headline doesn't support your message or story. Instead, try something like, "28% year-over-year growth." Show the audience what you want them to see.
By all means, make your data available in a detailed document for your audience to read without you. Your presentation is not the place to get into the details. If you're struggling to contextualize a portion of data and connect it to your story, that data might not be relevant to the presentation's objective. Focus on providing added context and value with each slide, not on dumping a lot of useless information on your audience.
Mind your fonts and colors
You don't need to be a graphic designer to make your presentations effective. Some simple guidelines to keep in mind include the following:
- Select easily readable font styles and font sizes
- Avoid the temptation to infuse a lot of unique character into font and color choices
- Don't use jarring or mismatched colors
- Don't compromise readability (such as by using dark-colored fonts on a dark background)
Focus on readability and visual harmony. Test that your slides are easily readable from across a room. If they're not, your color choices, font size, or the amount of text on your slide could be improved. If you don't trust your instincts with fonts and colors, there are color palette tools available online, or you can choose a carefully selected theme template. If your company has a default theme, that's always an appropriate choice. Before committing to a theme, click through the slides in the program's presentation mode to test for any weird transitions that may not be visible from other view modes.

What not to do
Review the slides below for an array of horrible design choices. As you scroll through, try to identify what is wrong with each slide:
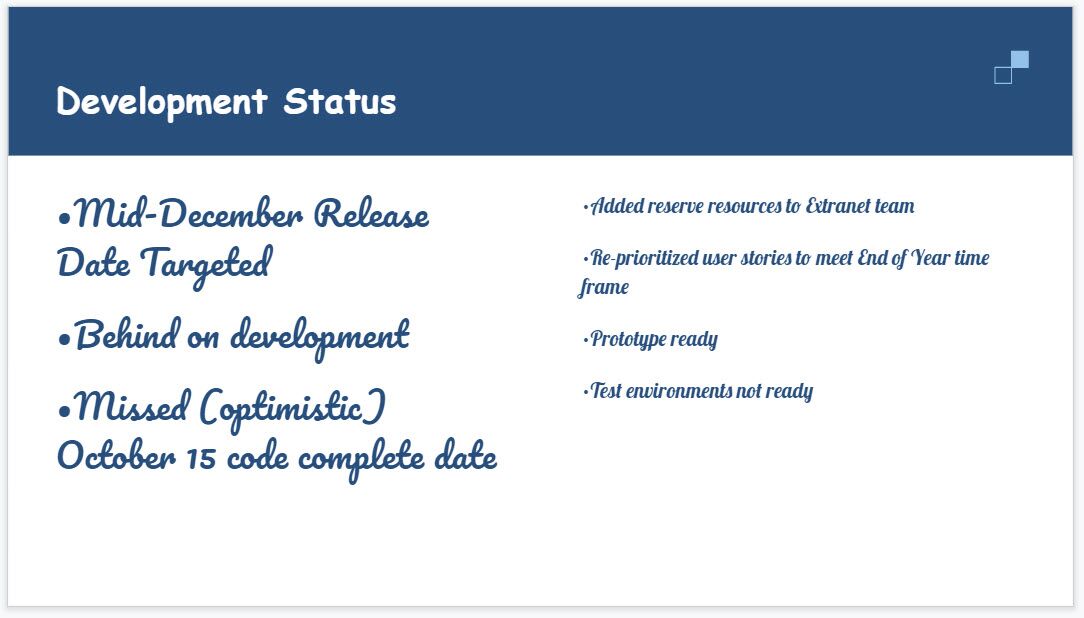

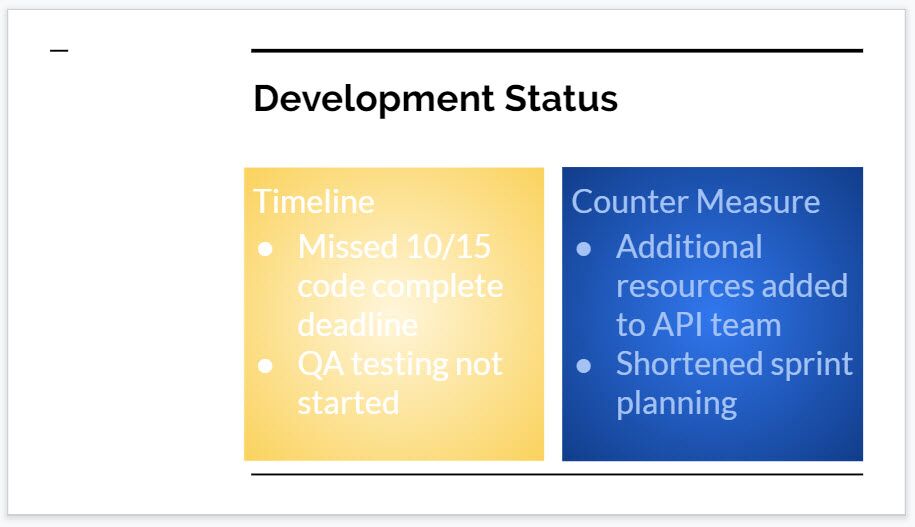

As these examples show, mistakes to avoid include the following:
- Hard-to-read, inappropriate fonts
- Text-heavy slides (too many words)
- Hard-to-read, weird color choices (such as light on light)
- Confusing data—no context, impossible to understand
Keep these examples in mind, avoid making similar choices, and you will already be on a much better path to good design.
Some good examples
Check out these presentations. What makes them good? What could make them better?
- Dan Pink presents a TED talk about motivation
- Netflix's slides about how they set their company culture
- Presentation on marketing plan of Spotify extending its services to India
Keep an eye out for good and bad examples of design in any presentation you attend or watch online. The more aware you become of these topics, the better you'll get at recognizing and applying presentation design best practices.
Activity 🎯
Examine the slides you designed as part of the previous checkpoint's assignment. It's time to apply or improve your slide design choices. Make a copy of the slide deck and edit it by applying the best practices discussed in this checkpoint. Ask yourself the following questions:
- Are there more slides than you actually need?
- Is each slide a single, complete thought?
- Can the text on each slide be quickly digested?
- What images, diagrams, or graphs would be helpful to support your message?
- Are the color choices and font sizes harmonic?
- Is it easy to read from across the room?
There is nothing to submit on Slack