20.3 Google Analytics 🎯
This section includes an Activity 🎯
Most companies use an analytics tool to track product performance. Examples include Google Analytics, Adobe Analytics, Heap, Amplitude, Pendo, and KissMetrics. These, and the many other analytics tools available on the market, are very similar to each other. Learning just one of these tools will help you master their basic logic, which will be an invaluable skill no matter which analytics tool you end up using in your next role.
In this checkpoint, you will learn about Google Analytics, one of the most widely used tools for tracking product usage. You will add a new impressive tool to your skill list—and resume!—and better understand how analytics tools work and how product managers use them.
By the end of this checkpoint, you should be able to do the following:
- Use Google Analytics to analyze a product's performance

Why use analytics tools at all?
Your product or products will be used by many people—far more than you can track individually. Imagine following the path of one user through your website. Maybe she clicks around a few pages, spending five minutes browsing before giving up. Now imagine there are 10,000 people doing the same thing simultaneously on your website. How can you understand their aggregated behavior?
This is where analytics tools come in. They help combine, slice, pivot, and filter the activities of people using your product so that you can identify patterns and understand what is happening. Analytics tools can also refute or back up assumptions with facts. They are very helpful in validating—or countering—opinions based on personal observations or anecdotes. For example, if your CEO thinks people are bouncing off your site because the search feature needs to be redesigned, you can disprove this assumption by showing her analytics that indicate the bounce rates are actually higher on product pages than your search pages. At most companies, hard data wins the argument.
Most importantly, analytics tools are often a catalyst for action. Product managers look at data to help them understand their users' actions, and then use this information to generate insights that result in meaningful decisions about what's next for the product. Interpreting analytics helps create good solutions that users love.
Want to see the difference in conversion rates across mobile versus desktop? Curious which countries are the biggest source of traffic coming into your site? Need to know which pages are the most likely to bounce users off your site? Tools like Google Analytics are exactly what you need.
How Google Analytics works
Google Analytics, or GA, is one of the most widely used tools for tracking product use. Though GA is similar to other types of data-tracking software, it is considered by many to be the gold standard of analytics tools. Learning GA will set you up to understand how similar analytics tools function. Also, GA offers a free demo, and comes with a great sample dataset for practice.
First, you should know how GA works behind the scenes. The easiest use case to understand is to imagine GA running on a website. To set up GA and connect it to your product, all your engineering team needs to do is include a piece of JavaScript code called urchin.js in the code of every page of your website. Every time a web page loads that JavaScript, the script runs and performs the following steps:
- Sets a cookie so that it can track a specific user on a specific browser. If the cookie is already set, it will read that cookie to tie that single user's data together.
- Sends information about the user back to you, which includes the following data:
- The browser used
- The size of the browser window
- The operating system
- The type of device used (computer, tablet, mobile phone)
- The web page visited
- The IP address of the user
- Their browser language
- Their referrer (the page they came from to get to this one)
- If they came to your page due to an ad and details to know which ad they clicked on
- Records any custom data that you send to GA, which includes the following information:
- If it's a search page, the query used
- If it's a product page, the product ID and price
All of this gets sent to the GA server via an API call on every web page where the GA JavaScript is included. Simply put, an API call is a request to a web server using an API, which you learned about earlier in the program. The server then aggregates all that data with the data from other users. This enables GA users to produce insightful reports and dashboards. Pretty amazing, right?
Next, you can set up a demo GA account and learn about the type of data you can analyze in GA.
You can learn Google Analytics in a free course set up by Google here
Setting up your demo GA account
Just like when you were accessing Google Sheets earlier, you'll need to use a Google account to access the GA demo data. Go to this web page, and follow its instructions. When you're done, you'll see the demo dashboard depicted in the image below. This is sample data from Google's e-commerce store, so that you can see how GA tracks individuals, conversions, and more:
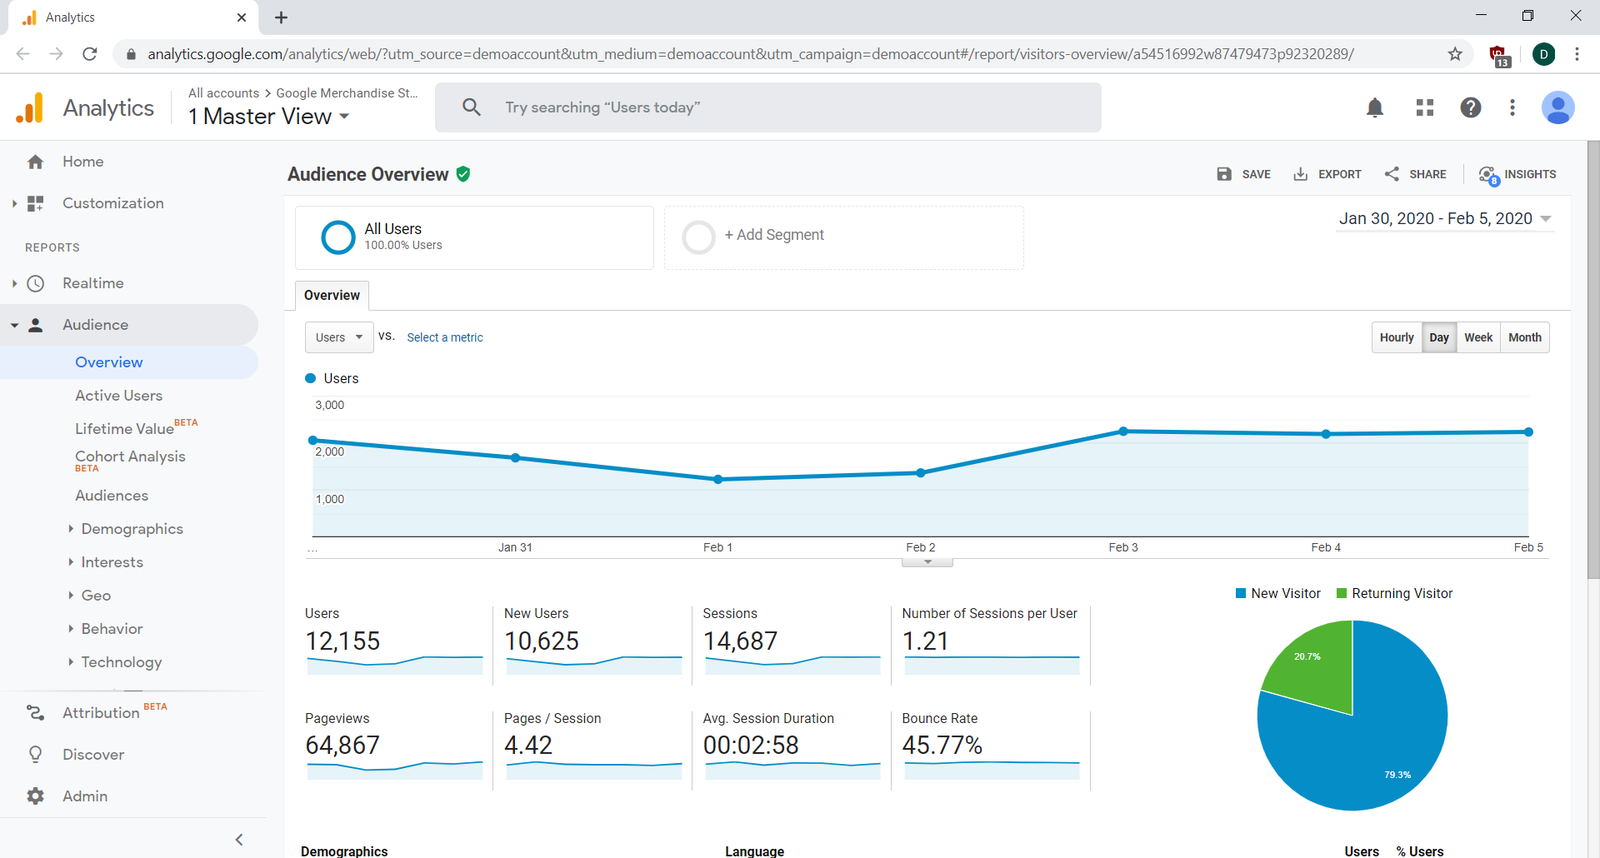
Check out all the information that this first view provides you with:
- Total users by day (in the big graph)
- Stats over the entire week, including:
- Total users
- New users
- Sessions
- Sessions per user
- Page views
- Pages per session
- Average session length
- Bounce rate
- The percentage of new versus returning users (in the pie chart at the bottom right)
That's a lot of information! Plus, you have options to change the timeframe of the report—you can tweak both the range of dates covered and whether it's daily, weekly, monthly, or even hourly information. You get all of this automatically just by adding GA to your website without any customization.
Keep in mind that this is all sample data, so feel free to play around with the settings and reports as much as you want. The best way to learn GA is to explore it on your own; don't hesitate to take a break from reading this checkpoint to explore and experiment with GA.
Audience
Want to know more about your site's audience? Look through GA's audience reports. You'll see these on the Audience menu in the images below—and hopefully in the tab of GA you have opened and are following alongside this checkpoint!
Much of the data about your audience is implied data. Google doesn't know the exact location or age of every visitor, but GA can make some pretty good guesses. Location can be gleaned from a user's IP address, and age can be estimated based on other sites that user visits. It's worth looking at some of these reports in detail, since you'll see them in many other analytics tools too.
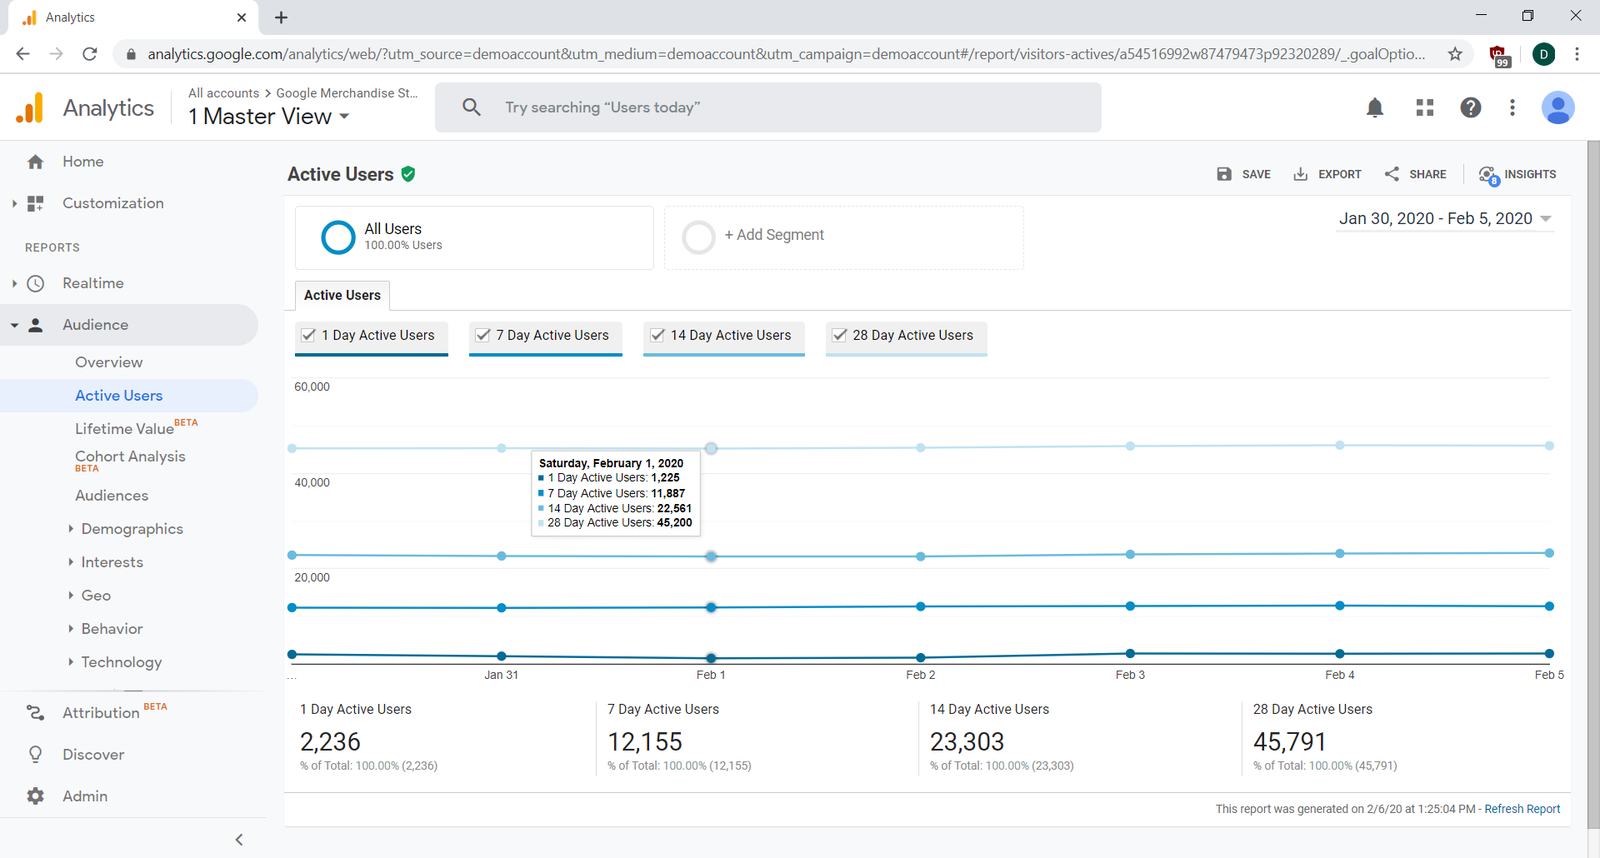
The Active Users page gives you a glance at the number of unique users who visited your site in the previous 1, 7, 14, or 28 days (depending on the filter you select). These are KPIs that many teams track, especially if you depend on repeat visitors to engage with your product or make repeat purchases. In the image below, you can see that as of February 1 there were 45,200 different people who visited the site in the previous 28 days. A big increase or dip in this number is indicative of the long-term growth (or decline) of your audience:
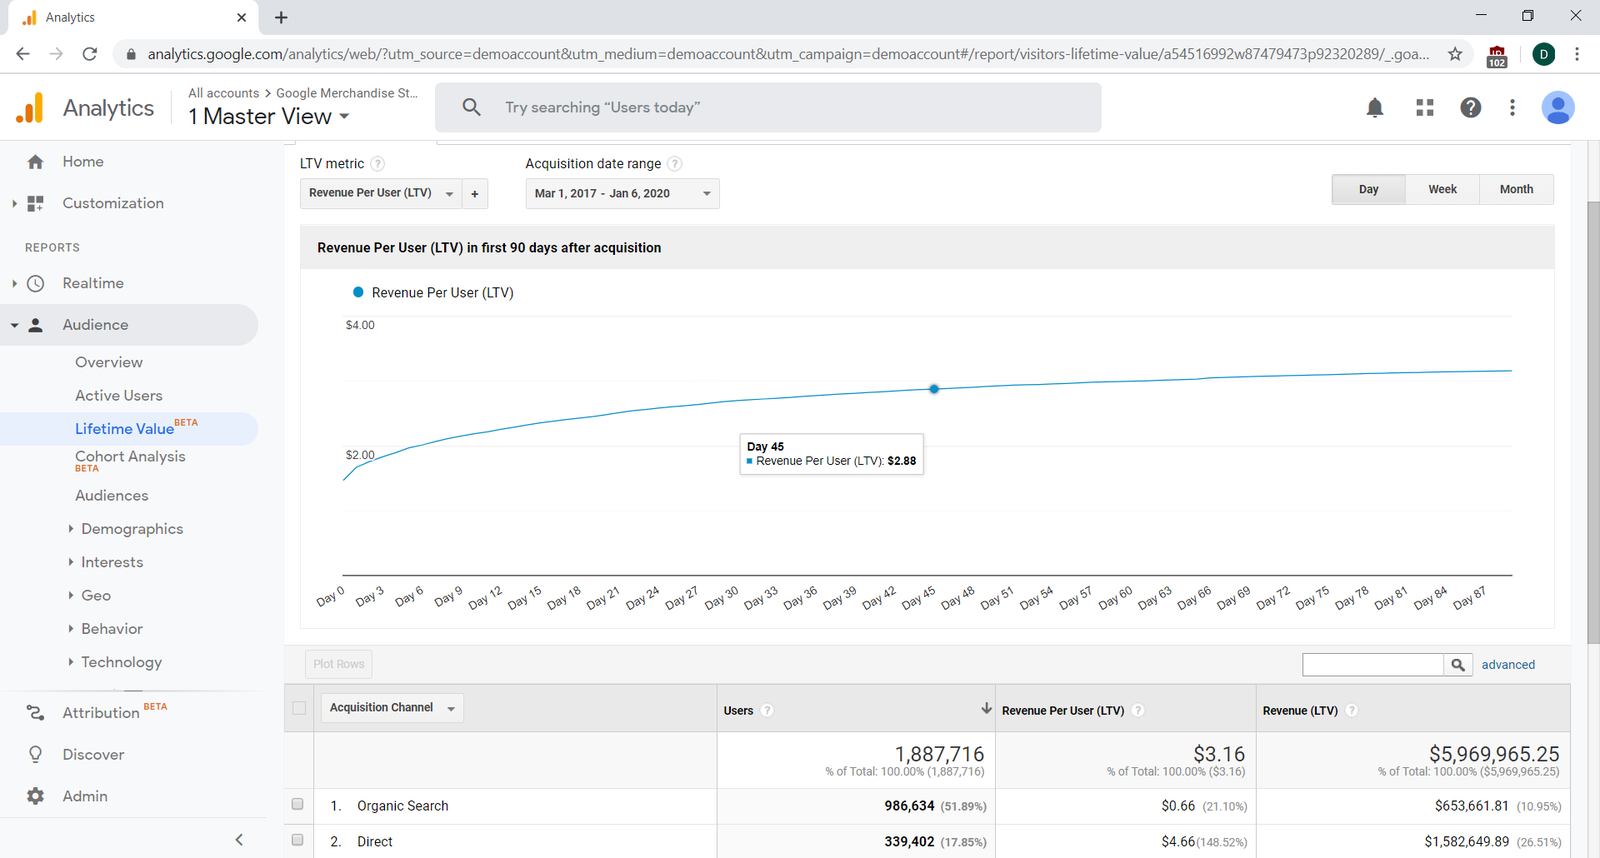
The Lifetime Value (LTV) graph shows you the revenue you can expect from each user on the Xth day after their first visit to the site. So, in the image below you can see that on the 45th day, you can expect a user to have generated $2.88 in revenue. This is of course an aggregate average; some individual users will spend more than others. You can also see the options to break the LTV down by channel or other acquisition details:
A cohort analysis shows you the percentage of people who come back to your website one, two, three, or more days after their first visit. It also lets you compare that statistic across users who arrived on different days; all the users who first arrived on a given day are considered a single cohort.
Below, you can see the analysis for users who arrive on Jan 31:
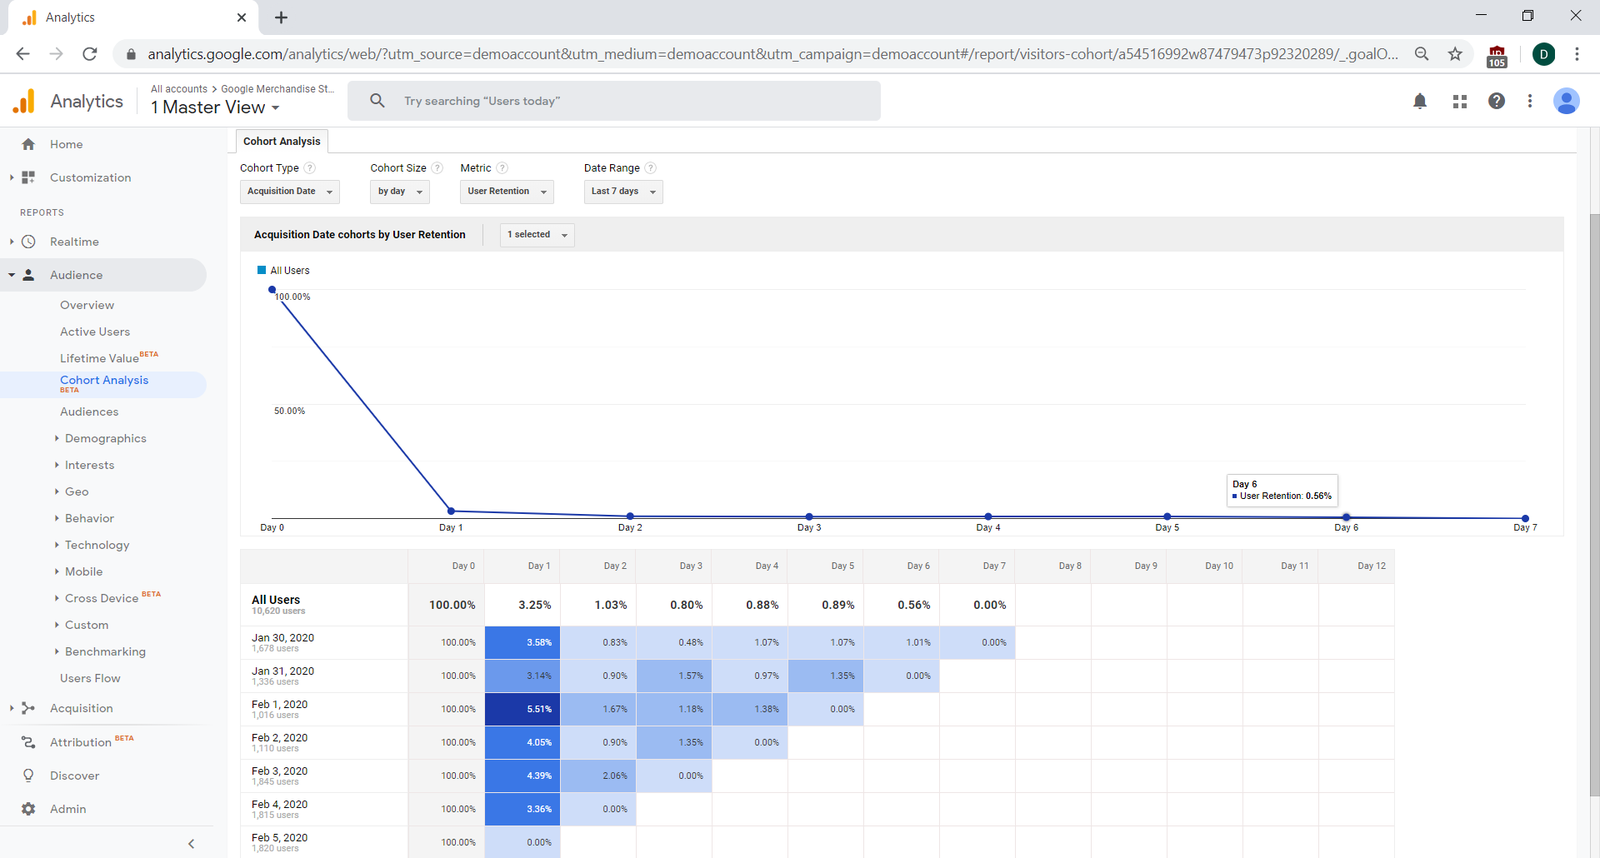
You can see that 3.14% of these users came back one day later, and fewer came back as time goes on. Cohort analyses are useful when you make a change to your product at a specific point in time and want to see how that change affects users. You do this by comparing the cohort that started interacting with your product after the change with people who used your product before the change. You only need to compare the percentage of people at Day 1 to know where they were at the same point in their experience.
The Demographics, Interests, and Geo sections all show implied information from your users:
You can expect it to be pretty accurate, because Google can make intelligent guesses about the visitors to your website. That said, you should always try to verify the info in other ways (such as with a survey) before making any big decisions based on it.
The Technology and Mobile sections show you details about the devices people use to connect to your product. This can help you see the overall trends of mobile versus desktop users, as well as which browsers or operating systems are the most common. This kind of information can help make difficult decisions easier. Say that you want to create a new feature and it's easier to launch it as an MVP in a mobile interface. If your data shows that most people visit your page on a mobile device rather than on a desktop, then you can make the decision to develop the MVP for mobile with confidence.
Conversions
You might remember that a conversion is the point at which your marketing message leads a user or customer to take a desired action. This is important to track to see how effective your new marketing initiative is doing. Are customers going to your new product section? Are they adding a product in their cart but not purchasing that product? You get the idea!
Tracking conversions in GA takes a little work. You can either count a conversion as happening when a user hits a specific URL, or you can add some JavaScript to inform GA when a conversion event occurs through their APIs. This demo already has that configured, so use the menu to scroll down to Conversions > Goals > Overview to see what this looks like.
Note that conversions are not just a single thing. Your product might have several conversions like completing a purchase, completing registration, or filling out a Contact Us form. You can choose to see data from all or any individual conversion event in these reports by selecting the appropriate one in the Goal pulldown menu at the top of the report.
If you've gone the extra mile to use the GA API, you can send conversion details like the purchase price so that GA can track your revenue too. The e-commerce report is further down the menu under Conversions > Ecommerce > Overview. If you keep going down through the e-commerce reports, you'll also see detailed breakdowns of the conversion funnel, checkout funnel, and even individual product performance.
It's incredibly valuable to customize your analytics tool's implementation so that it has as much data as possible for your analysis. With your developer or analytics team, you can send all kinds of data to GA—triggers for key events that happen in a user's lifetime, details about your products, and more. And when there's a purchase (or if someone changes their mind to buy during checkout), you can tell GA what's in that person's cart so that GA can track the items and value of that conversion. It's just a little extra info that provides a huge amount of value thanks to GA processing that data for you.
Acquisition
You can also learn more about how your audience got to your site. This is useful when you're trying to understand where your users come from, how they learned about your site, or the effectiveness of each channel. A channel is how your customers get to you—from an email link, Instagram page, Google search, etc.
Go to the Acquisition menu item and hit Overview. This is your main dashboard to see the breakdown of different sources like organic (search), direct (entering the URL in the address bar), referral (from other blogs, news sites, etc), social, and other sources that are driving traffic to your website. It also breaks down the conversion rate by source making it easy to see which sources are the most successful for you. (You did set up conversion tracking, right?)
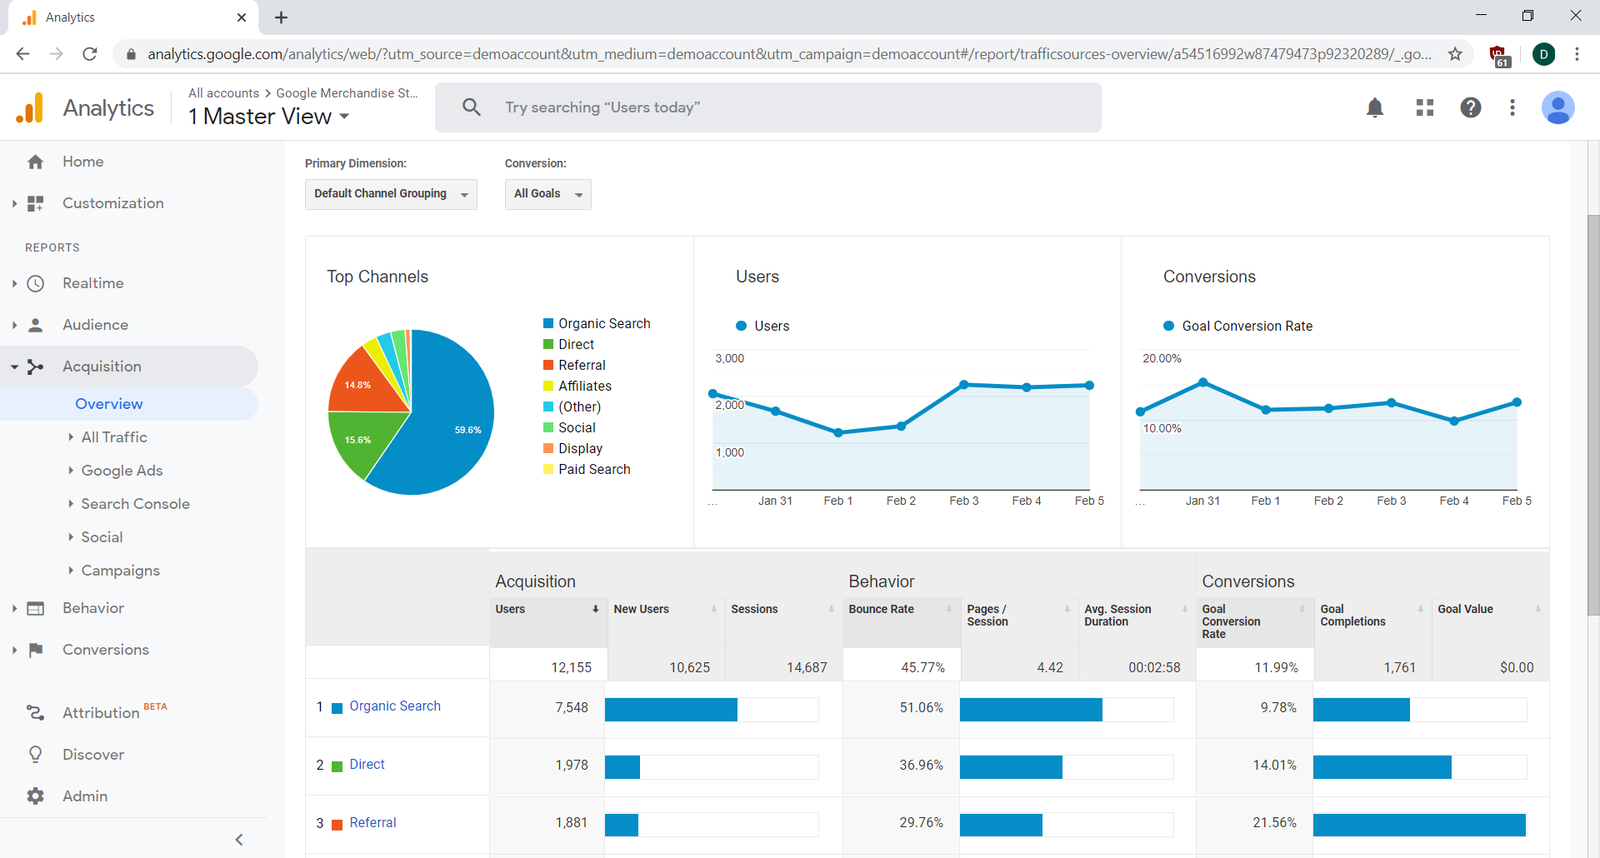
Note the menu items for Google Ads and Search Console on the left. While they're not configured in this demo account, these dashboards break down the performance of individual ads and individual search queries of visitors to your website. This data is really important for you and your marketing teams to ensure that your ads are performing well and to learn which queries are the ones that are driving most users to your site.
One thing to know about acquisition tracking are the terms they use to break down the results. Together, they're called the UTM parameters (UTM stands for "Urchin Tracking Module"). You'll see these in analytics tools and hear them often from your marketing team. The main ones are:
- Source: The site that sent you the traffic
- Medium: The medium where the link was clicked like an email or ad
- Campaign: Provided by your marketing team, this is the specific promotion that the source referred to, like "summer sale"
- Term: The search term that was used to find your site
The cool part about tracking these is that you can follow a user to see which specific UTMs are driving the best results. For example, maybe there was one email campaign with a discount coupon that drove a ton of engagement to your site with many conversions. If you set up your UTM tracking correctly, GA will automatically segment and track these for you! Work with your marketing and engineering teams to make sure all their links are correctly tagged so that they're tracked correctly.
Behavior (content, flow)
Another way of looking at your site analytics is at the specific pages and series of pages that your users view. As a PM, you'll want to understand this in detail because there could be certain pages, sequences of pages, or other elements of your site that don't perform to your expectations. Analytics tools like GA can reveal these gaps in your flows.
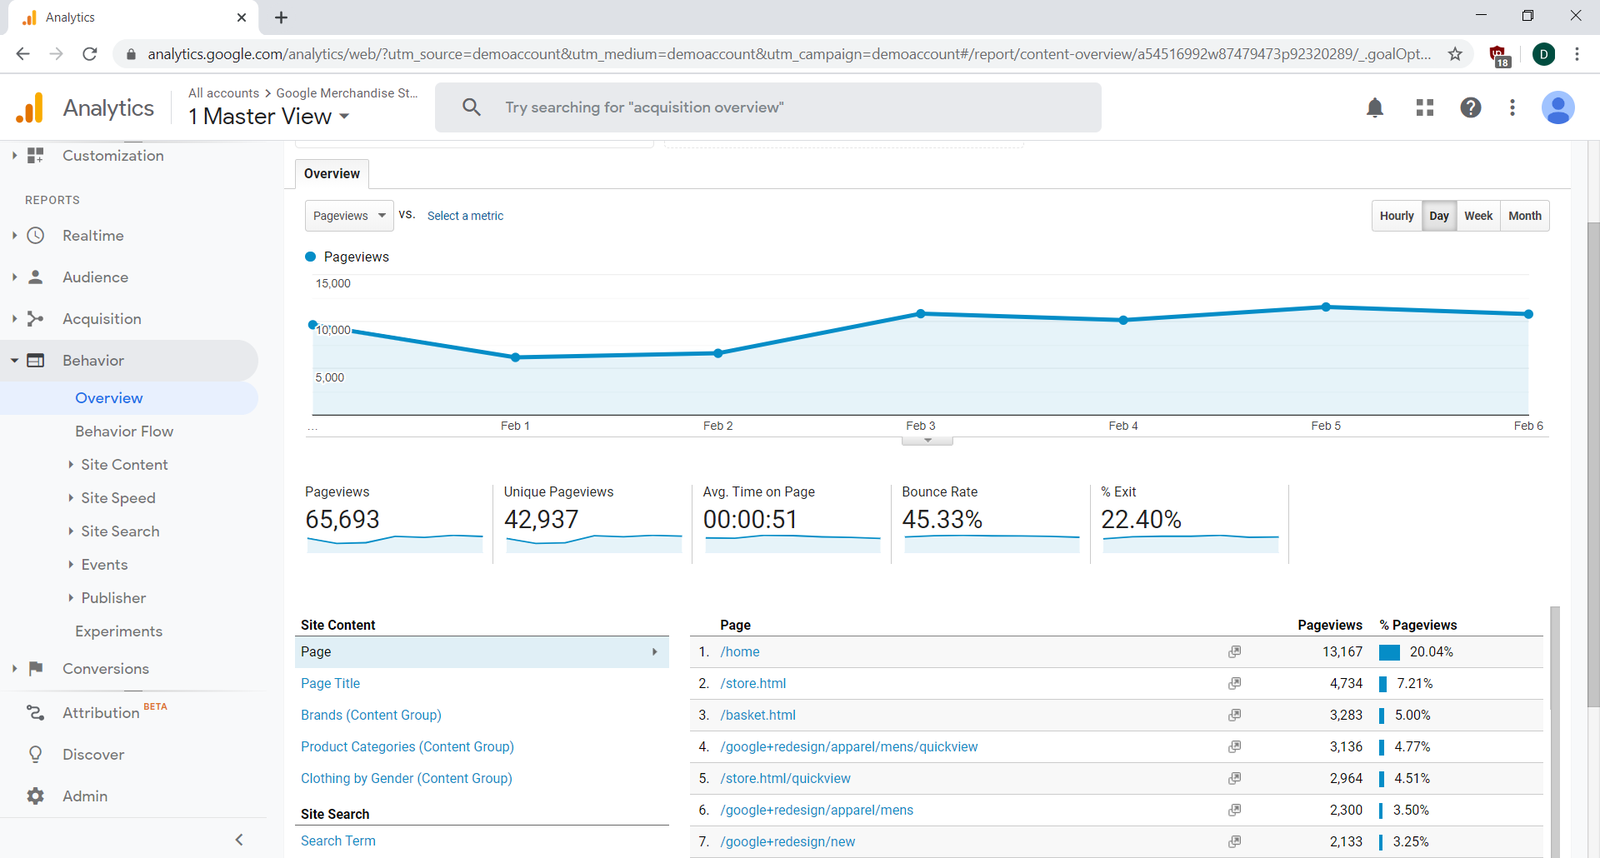
In GA, this is all lumped together under the Behavior section. The Behavior Overview section will let you quickly see the top pages by URL, page title, and—if you've configured it—products.
The Behavior Flow report is one of the most valuable tracking reports if you can master using it. It shows the trail of pages your users take through your site. By default, the left column shows the page your user had landed on, then each column shows how they flowed to the next page, the page after that, and on from there. It also shows how many users dropped off; the height of each block is proportional to the number of users who visited that page, and the red trail on the right shows you how many users bounced.
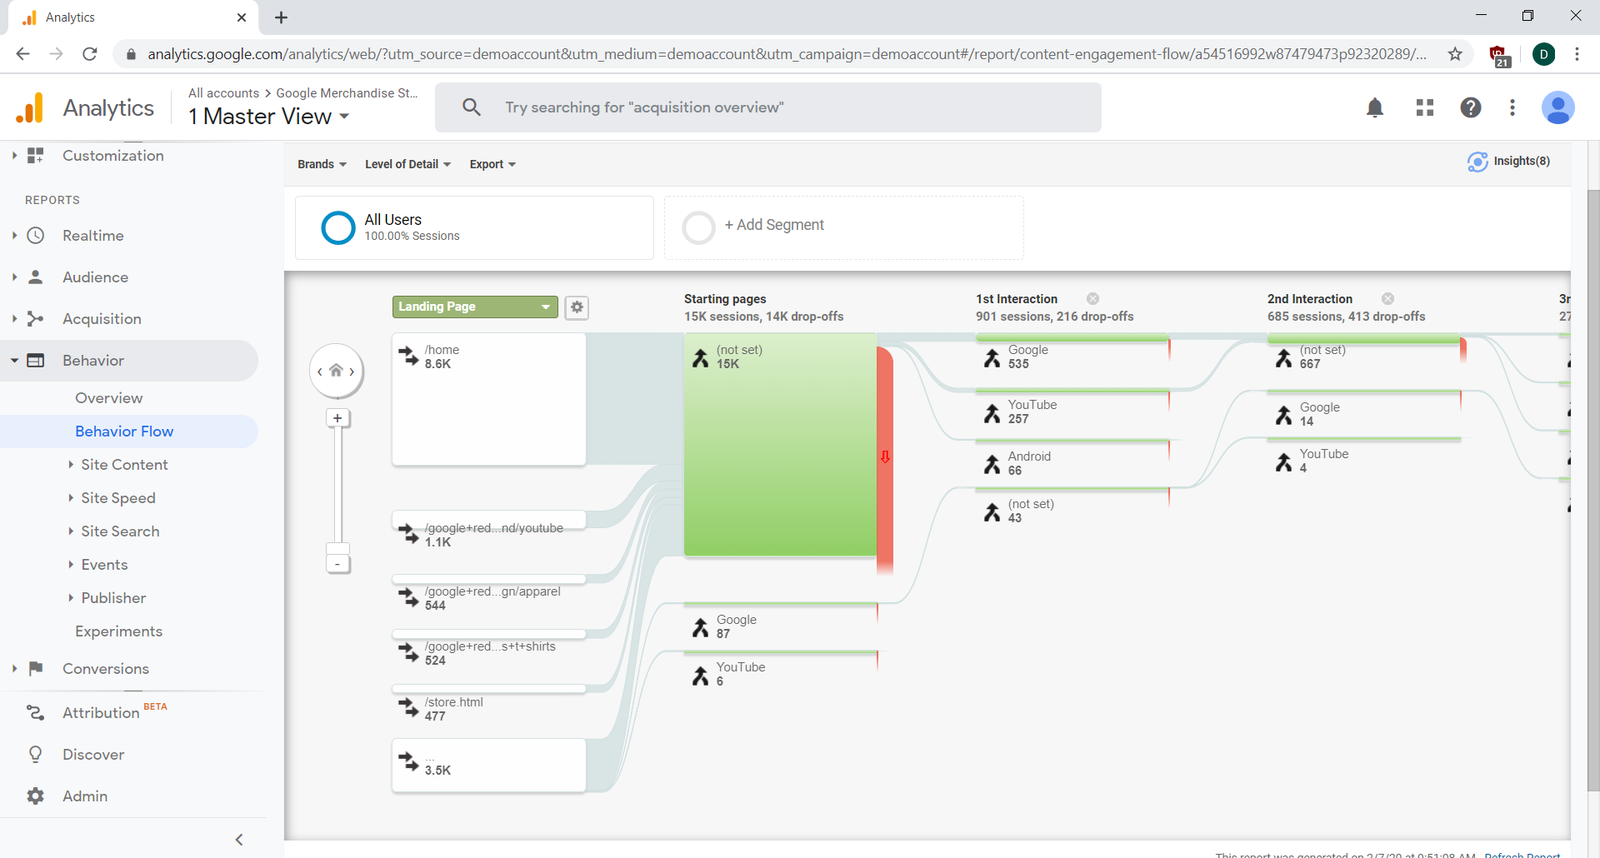
You can change the left-hand column to show users by landing page, UTM, device, or many other categories. It can be insightful to see the different paths that people go through based on their source, device, or country. Finally, you can click any of those blocks to highlight or filter traffic just from that block, so you can isolate the path of your US users over all other countries.
The Site Content, Speed, and Search reports are useful to dig deeper into how your site is working for your users. The Site Content report will tell you how individual pages are performing, the Speed report is an approximate measure of how long it takes for a page to load, and the Search report will show queries on your site's internal search.
The last types of reports, Events and Publishers reports, are only applicable if you've set up custom events or are advertising on AdSense/AdExchange.
Filters and segments
By now most of the main reports in GA have been covered, but there's one other set of features that you should learn about. GA has robust filtering, allowing you to filter data in individual reports or across your entire GA data collection.
Why is this useful? First, you'll probably want to filter out internal users from your reports based on user properties (which you can send to GA using the JavaScript API) or by IP address (if you know the addresses that your internal users are visiting from), since you're really only focusing on external users (your customers!). Second, you may want to isolate specific segments of users when looking at reports, like "just users from the 2020 discount campaign," without having to drill down in every report.
The preferred way to do this in GA is via Segments—the big blocks at the top of every report. If you click on Add Segment, you can choose from a few prepared segments like Mobile Users or Bounced Sessions. You can see the segments side by side, letting you compare this segment to other segments or to all users. GA lets you add up to four segments at once.
You can also create your own segments. After hitting the Add Segment button, click New Segment. You'll be presented with many options for how to filter your segments—by demographics, source, and even specific conditions or sequences of events like "visited the home page then completed registration." They're easy to set up, and they can help you isolate specific groups of users to see how they perform.

Additional GA info
You've learned how to use GA for websites in this checkpoint. GA can also be used for desktop and mobile apps, as well as any app that can connect to the internet. GA has robust APIs for most popular programming languages. It also has an HTML API if you need to create your own tracking solution. Mobile, desktop, and TV apps don't have URLs or web pages, but they do have screens which can be tracked instead.
There are a few limitations of GA that you should know about before you fall in love with it. First of all, because GA tracks web traffic using JavaScript, it will not track users who use ad blockers when visiting your site. Also, recent privacy laws like the GDPR in the European Union or the CCPA in California restrict this tracking to users who specifically opt in to being tracked. These laws will be discussed in greater detail in a future checkpoint. For now, just keep in mind that GA probably underestimates data, and it might be missing conversions or other tracking data for people who have blocked tracking.
Also, GA does not do a great job at filtering out bots and crawlers. For example, there are some malicious automated systems that will go through your website, leaving referrer URLs for you to click that contain malware or other spammy content. Bots can inflate your traffic and bounce numbers (and decrease conversion numbers), so check your data regularly to see if they are a problem.
Finally, GA can't track everything. For example, you won't be able to see any search query data from Google unless you set up Google Search Console and integrate it with your GA. Also, due to the way web technology works, you won't be able to see any referrers if the referring site was secure (that is, one that has a URL starting with https://). This is true for every analytics tool, not just GA). Other GA users might be misled because of these issues. Take the time to educate them about these limits so they can make better decisions with the data.
Dealing with so much data
By now, you might feel overwhelmed by the amount of data, reporting, and analysis you can do with these tools. You could spend all day sifting through reports and not come out with any insights. How can you better manage this overload of information?
First, have a goal when you're looking at data. What are some specific questions you'd like to find answers to? For example, don't just look at your top content. Ask how your top content has changed since you launched your new home page. If you're unsure what to look for, ask coworkers for ideas about what they’d like to learn.
Second, automate as much as you can. GA. and nearly all other analytics tools, have the ability to create reports that get emailed to you on a regular basis. They can often be configured with alerts when specific events or triggers happen, like a notification if your conversion rate drops below a certain threshold. As an alternative, set up a few reports and bookmark them so that you can review them first thing in the morning.
Finally, make sure that you or someone on your team has ownership over the quality of the data you're collecting. Every new feature you launch should have a plan for how you're going to track the data. Someone should regularly check to ensure that your analytics tools are correctly tracking your data. And every year or so, you should do an audit of your analytics to ensure that your tools and tracking are meeting the needs of the people in your company.
Google offer free analytics courses with their Google Analytics Academy, which helps you learn about Google's measurement tools so that you can grow your PM skills navigating intelligent data collection and analysis. Take some time after completing your assignment to try out one of their free courses.
Activity 🎯
Explore the Google Analytics demo account, and practice thinking about it—and using it—like a PM:
Complete the Google Analytics beginner course here