20.4 More Tools
General analytics tools like Google Analytics are not the only source of information and insights that you can use to understand your products. New, specialized analytics products are being released all the time. And as product managers are always on the lookout for better tools to help understand their users and evaluate their products, it's important that you be familiar with some of the more commonly used options.
Some of these tools are specific to technology products and interactions; being familiar with them will make you a better candidate for tech jobs. Other tools are primarily used by other teams, like sales or marketing. Knowing how to use them to find valuable information can set you apart from other product professionals and make you a better collaborator.
By the end of this checkpoint, you should be able to do the following:
- Describe two to three specialized analytics tools that can be used to analyze products

Why go beyond general analytics?
You might be wondering, "Why do I need to be familiar with any more analytics tools? Google Analytics does everything!" You are partially right. General analytics tools like Google Analytics try to do a little bit of everything. This range makes these tools a great choice when you are trying to understand your product at a high level or answer general questions. However, these types of tools are not always the best ones for the job.
For example, Google Analytics is not the right tool to use to analyze the results of an A/B test. These tests focus on a very specific part of your product, and generating a Google Analytics report on just that narrow piece of your product can be difficult and unnecessarily time consuming. If, however, you use a specialized A/B testing tool, the process to generate the same report will be much faster and easier. Furthermore, the report itself will likely be easier to use, because the tool is specifically designed to handle this limited type of information.
Similarly, cohort analysis, which you learned about in the previous checkpoint, is a great way to examine how changes over time have impacted your product. But general analytics tools don't excel at this type of analysis. The results can be confusing and hard to work with. Tools made specifically for cohort analysis will do a much better job.
Finally, when you're evaluating individual features, events, or pages, bulk analysis tools like Google Analytics often fail to give you actionable insights because they oversummarize data. In this case, the best way to find the information you need could be to dig directly into your database or event tracking systems.
To be the most effective product manager you can be, you need to know the limitations of general analytics tools and understand the possibilities offered by other more specialized tools. In this checkpoint, you'll dive into some of the most popular specialized tools available. Many of these tools have demo or trial accounts available. It's recommended (but optional) that you sign up for a few of these and explore them further to really get a sense of what they can do.
Note that if you use ad blocking software, you'll probably need to disable it to use these demos, because many of these sites are considered to be "trackers" by ad blockers.
Heat maps
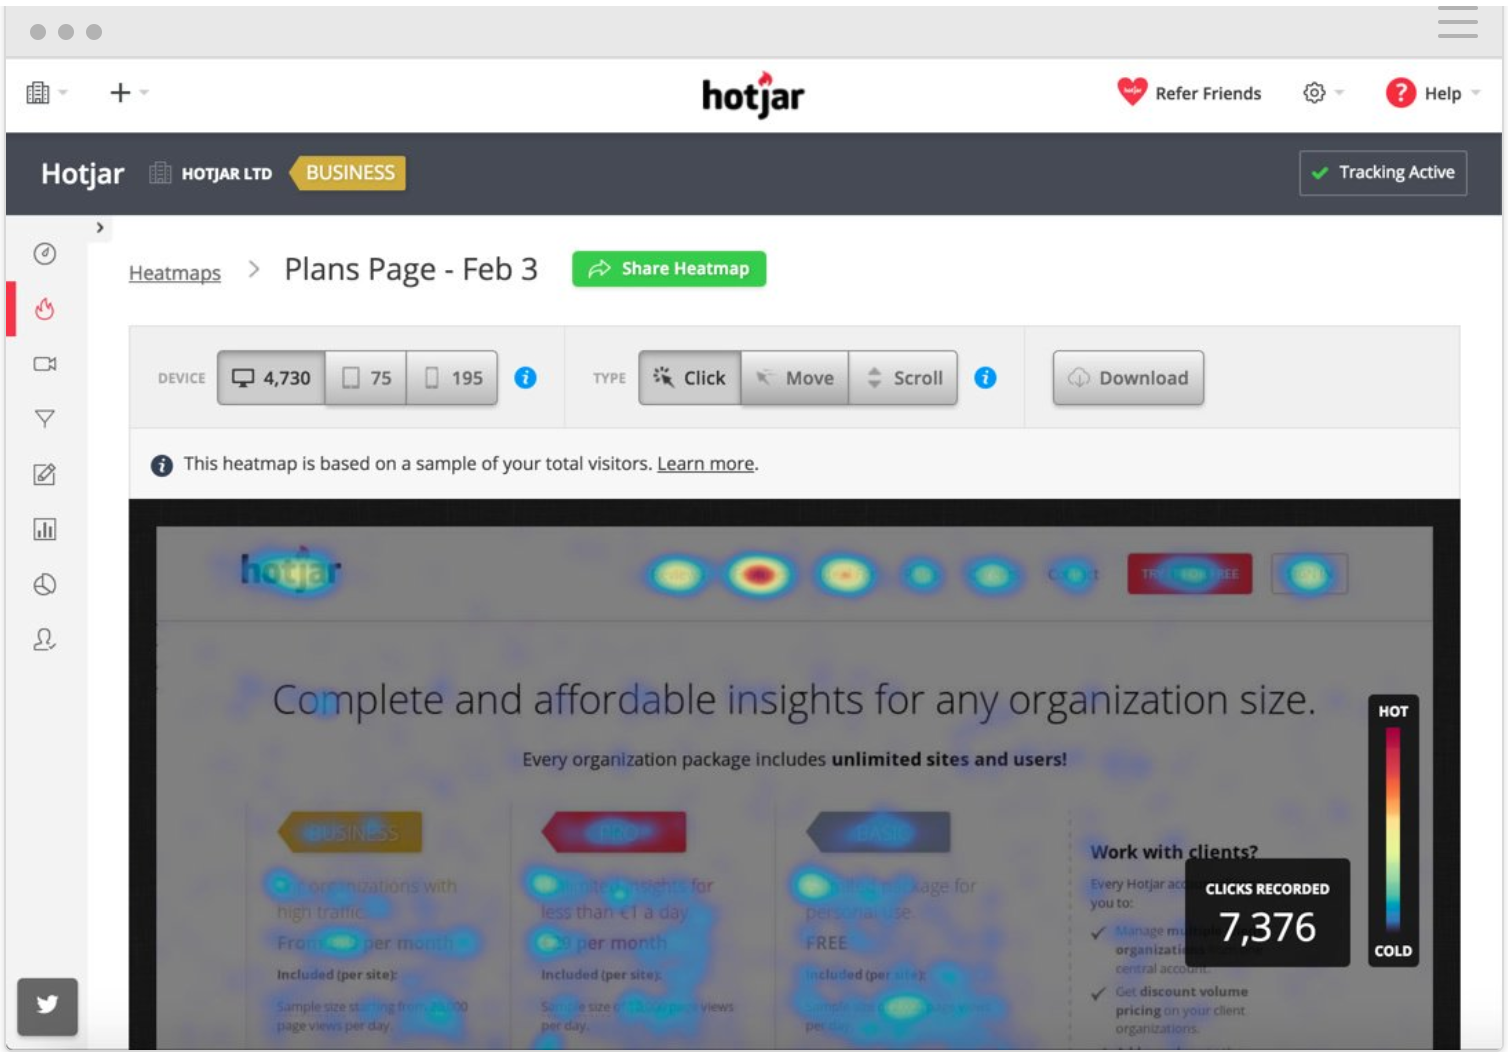
A heat map is a visualization of where users have been interacting with an app. It uses color to indicate where users viewed or clicked, with red representing the "hot spots" (hence the name heat map). Tools that produce heat maps include CrazyEgg and HotJar.
A click map is a kind of heat map that shows a colored overlay on top of an app's pages. This overlay goes from green to red depending on how often people are clicking on each particular spot. It provides an easy way to see which links or buttons are the most popular on a particular site.
Similarly, a scroll map shows you how far down a page users scrolled. Usually this is broken down by the percentage of users who scrolled down to a specific spot in the page—for example, you can see in the image below that 44% of people scrolled to the green-blue spot:
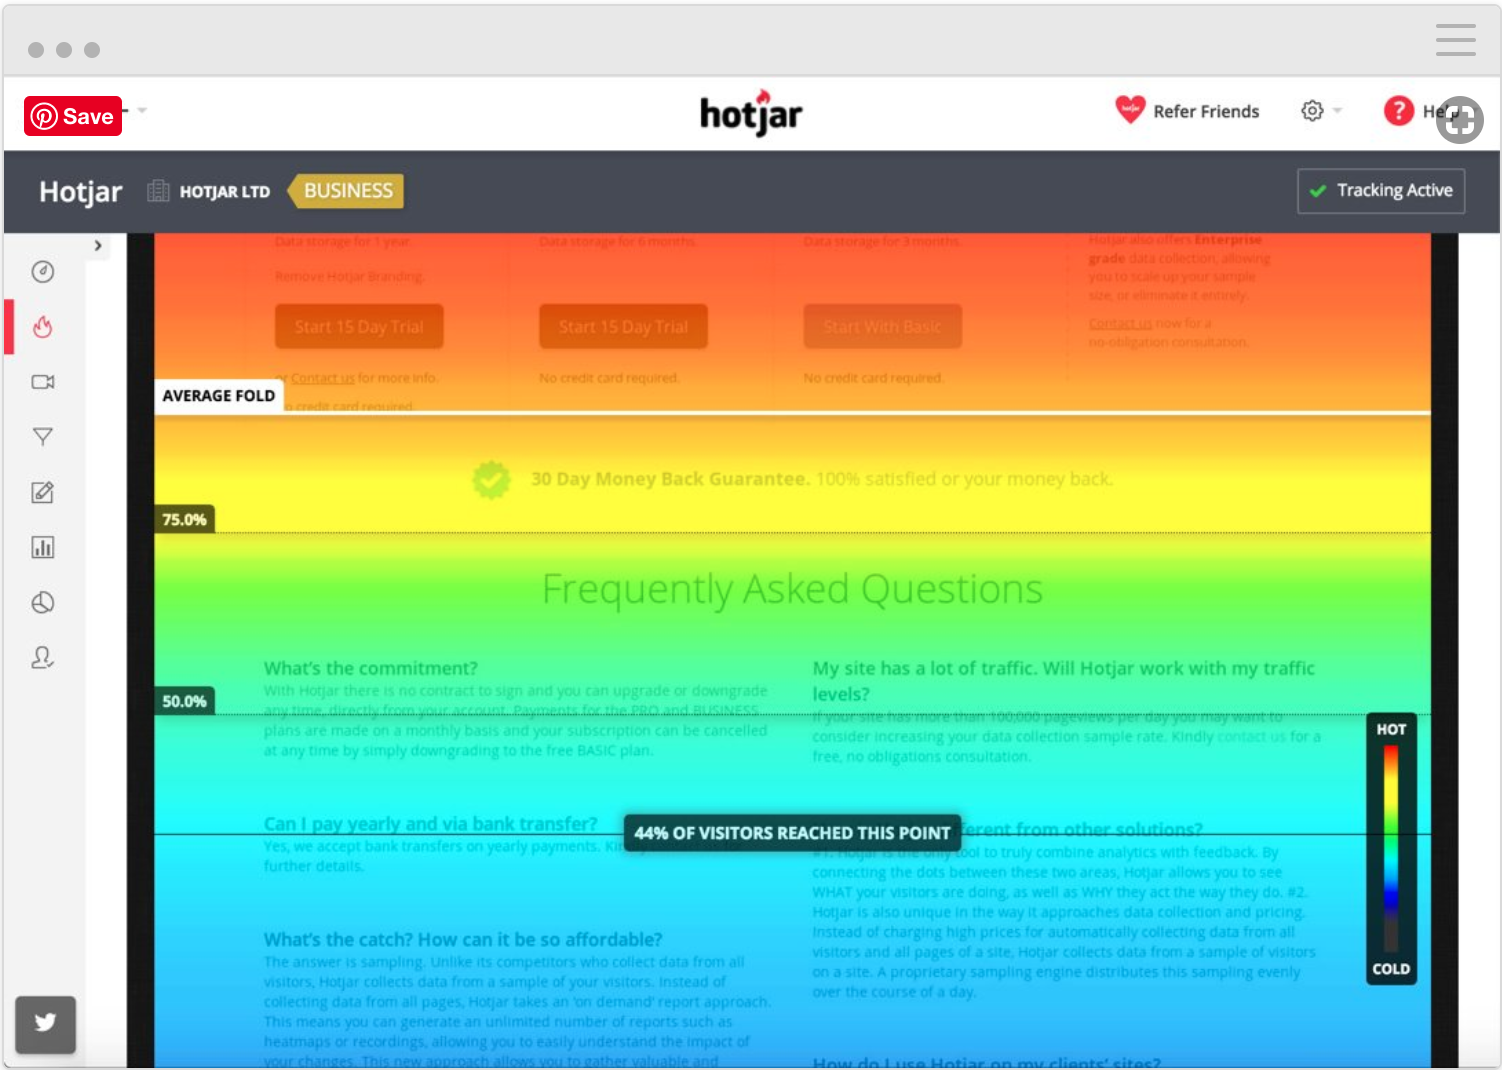
Keep in mind that many people who do not scroll down the page arrived at your site by mistake. They simply hit the back button to return to the search results page or referring site they came from, and they were never really your users. You can confirm this by using your bounce rate to figure out how many of the visitors who didn't scroll down bounced off your page within seconds. Don't fall into the trap of trying to put all your content above the fold, which is the portion of your pages that users will immediately see. Research suggests that users who are interested in your product will make the effort to scroll down to find what they are looking for.
Session recording
Another powerful tool in the analytics toolkit is a recording of an individual user's session on your website. Tools like Mouseflow or HotJar can help you record user sessions.
This includes every page viewed, scroll action, click made, data entered, and so on. While most analytics tools aggregate data from a large number of users, session recordings let you see the interactions on your site on an individual user level. This can give you insight into, for example, how people are struggling to fill out a form on your website, or how the long load times of your search feature cause users to give up. It can also reveal which parts of your app an individual user lingered on the most, or expose surprising interactions.
Follow this link to see what a screen recording looks like on HotJar. You'll notice how mouse movements and clicks are recorded using both visual and auditory cues. If you can't view the example in the link, please disable your ad blocker and try again.
Cohort and retention analysis
One of your key product metrics is retention—the rate at which you get users to return to your website. You learned a little about this in Google Analytics. Tools with specialized cohort analysis, like Mixpanel or Keen, can give you a better view into which user groups are being retained.
For an example, look at this retention analysis generated by Cohorts by Keen IO:
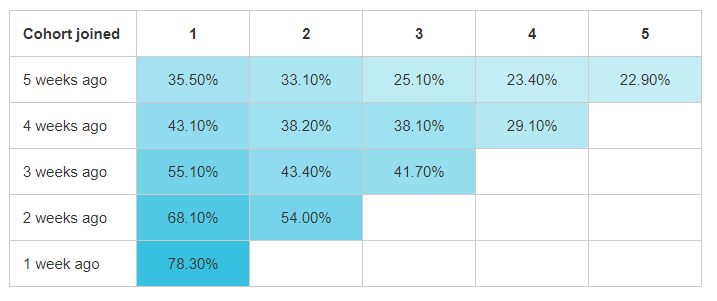
To read the table, start by reading down the columns rather than across the rows—for example, for the group that joined five weeks ago, 35.50% of them came back one week later, 33.10% came back two weeks later, and so on. Looking at the group who joined four weeks ago, 43.1% of them came back one week later. That's a big boost compared to the group who joined five weeks ago. And the group who joined a week ago returned in an amazing 78.3%. Retention analysis can be a great tool to use to validate how changes you made to your product affect retention. It's also a very helpful way to compare user groups by their relative "age" using the product.
Data aggregation and distribution
You might start to wonder how all of these tools can stay in sync and how you can keep track of all of them. The answer is—more tools! Seriously, it's now easier than ever to keep track of your data, assemble it together, and distribute it across the different tools you use.
For example, if you have many analytics systems and want to ensure that they all are receiving the same data, a tool like Segment can help. Segment is a data distribution system that will distribute your data to any number of destinations, such as Google Analytics, your marketing team's tools, your databases of choice, and other places that might benefit from data analysis. It can even ensure that a single user can be tracked across all of those tools.
There are also tools that combine (aggregate) data sources together for faster and easier monitoring of your systems and data. Datadog is one such tool; it provides dashboards pulled from your other tools. This gives you and your system administrators a single place to check the overall health of your product and systems.
Investing in data aggregation or distribution tools can be time consuming and expensive. But using such tools will help you keep data in sync across disparate tools and vastly accelerate your future work in adding that next tracking system.
Additional tools
The tools you will eventually use in your role as a PM will vary depending on the company. Many companies use only one or two analytics tools, as these tools can be very expensive. The choice of tool largely depends on the number of users or amount of data you need to track. Generally, the larger the amount of data, the more robust the analytics toolkit required.
There are many additional tools that technology companies (and others) use for various product-related purposes. Here's a list with some examples:
Advertising tools
These tools are how you get the word out about your product or products to your potential users. They all include an analytics component, which can help you understand which of your advertising campaigns or specific messages are resonating best with your users:
- AdWords
- Adobe Advertising Cloud
- Facebook Paid Ads
User event tracking tools
User event tracking tools help identify user events (actions) in your product. They are integrated into your product and can automatically capture data and generate reports on how users are engaging with it, like reporting which users are clicking a particular button or completing specific steps in your conversion funnel:
- Mixpanel
- Amplitude
A/B testing tools
These tools are specifically dedicated to creating and tracking A/B tests. You've already encountered some of these in a previous checkpoint about A/B testing:
- Optimizely
- Google Optimizer
Business intelligence tools
These are tools that connect directly to your product's data or database and allow you to visualize, analyze, and identify issues and opportunities. You will learn more about these tools, particularly Tableau, in the next module:
- Tableau
- Looker
- Periscope
Have you had a chance to use any of these tools in your current or past roles? If so, consider adding them to your resume or LinkedIn profile. While employers don't expect you to be an expert on every possible tool, being familiar with at least a few is helpful. You never know when a hiring manager will decide to go with one candidate over another simply because they're thinking that onboarding would be faster with someone who already knows the company's tools.
If most of these tools are new to you, look for opportunities to start using some of these. A good first step is to find out if your current company is using any of them and talking to coworkers about helping out or shadowing their work to learn more.
That said, more important than knowing any specific tool is your ability to understand the conceptual role that analytics play in product work—what kinds of things can be tracked, when would you want to track what, and what kind of insights analytics can provide.