21.2 Tableau For PMs
Tableau is one of the most widely used BI tools, and it is known mostly for its ability to visualize data. As a product manager, knowing Tableau will give you some specific advantages. Most importantly, it will allow you to do your own data analysis.
In larger organizations where you might be collaborating with data analysts, knowing what they do on a deeper level will make you a more effective collaborator. Some larger organizations even hire a Tableau engineer specifically for the task of connecting data and creating new dashboards. And if you end up working in a growing startup organization, gathering data insights could fall under the responsibility of the product manager, so knowing how to use Tableau will be a valuable skill.
By the end of this checkpoint, you should be able to do the following:
- Demonstrate familiarity with Tableau
Why is Tableau so popular?
After being founded in 2003, Tableau quickly stood out in the market because of its ability to communicate with outside systems and the fact that it was ready to be used off the shelf. In other words, it doesn't take years to integrate Tableau into any particular company's highly customized stack. This model has allowed data in Tableau to be robust and unique in the following ways:
- It integrates. Tableau can operate on data sources ranging from database servers to workbooks to geographic data. It handles all the problems of converting data types and connecting to varied sources with little or no effort. Doing the equivalent yourself with your developers would be prohibitively time consuming and costly. Check out this link for all the sources Tableau connects to out of the box.
- It's democratic. As an interface-driven program, Tableau opens up data exploration and analysis to those without a technical background. You don't need to know SQL or proprietary languages to access data, and you don't have to submit requests to your data analysts to wait for a response. Instead, you can do it yourself; it's "self-service BI."
- It's fast. Getting Tableau up and running in an organization is quick and relatively easy. In an age when business needs change daily, it's essential to have flexible, intuitive tools for data analysis and reporting.
All of this leads to Tableau having a large and active following. Many cities, for example, have regular group meetups for Tableau users. Tableau also hosts an active community forum on its website. Tableau was purchased by the cloud-based software company Salesforce in 2019.
For an overview of Tableau, and the breathtaking visualizations users can make with it, check out the video below by Alex and do watch his entire playlist:
Ready to create your own frame-worthy dashboards with Tableau? Continue reading. Select Histogram (the middle, second-from-bottom iconmiddle icon in the second to last row
Tableau's product ecosystem
How does Tableau make money? Recall an earlier checkpoint about ecosystems. Tableau operates on a freemium model. They have free products and several tiers of paid products that offer upgrades and features for organizations. There are two ways to think through their ecosystem—the license you need to buy, and the products you use with that license.
The licenses come in a few tiers, with pricing based on the number of users, the type of license, and whether it's for an online or desktop product. Those tiers are:
- Public: Tableau's free tier. If you're trying to process or visualize any large amounts of data or if you need database access, you'll need to get a paid license.
- Creator: Meant for the admin user, like a data analyst. If you pay for Tableau, you must buy at least one of these licenses.
- Explorer: Meant for the self-service analyst, like a product or sales manager. Gives you lots of features, but not the administrative tools.
- Viewer: Meant for people who use the visualizations created by the users above, like executives or individual users.
And here's a quick overview of Tableau's current product line:
- Tableau Public: This is a free, limited-use product from Tableau. Users can create public, interactive dashboards that are saved to the cloud, allowing anyone to see your data. Limits include the inability to connect to databases and that all visualizations are made public.
- Tableau Prep Builder: A tool meant for Tableau Creator users to connect, manage, and convert data for use in other Tableau products.
- Tableau Desktop: A paid version of Tableau used by the Creator user that has more integrations and fewer restrictions than the public version.
- Tableau Reader: This tool allows Viewer accounts to interact with visualizations built and shared in Tableau Desktop.
- Tableau Server: Tableau Server is a hub that saves and distributes outputs from Tableau Desktop. Other Creators, Explorers, and Viewers can access these products by logging onto Tableau Server. The server can be hosted within an organization's network for companies who don't want to use Tableau's cloud tools.
- Tableau Online: This is a cloud-based deployment of Tableau Server that is maintained by Tableau itself rather than the subscribing organization.
- Tableau Mobile: This is a mobile-optimized client for optimizing Tableau reports using Tableau Server.
- Tableau Embedded Analytics: If you want to share Tableau visualizations in your product (say, to create dashboards for your users), you need to buy a separate product and licenses for that.
With the help of the Tableau sales team, an individual or a company can mix and match the licenses and products that they need for their analysis and visualization needs.
Tableau and data storytelling
Telling stories with data is a powerful tool to help you communicate with stakeholders. Tableau will be a major asset in building your data storytelling skills. Why? Because Tableau lets you quickly create and experiment with different types of visualizations.
Often, the most powerful data stories don't come out of one visualization in particular. Instead, they come from a set of visualizations that have been meaningfully arranged. Tableau allows us to tell these multifaceted and complex data stories. You can build dashboards for at-a-glance presentations or stories for a PowerPoint, like a guided tour through a dataset.
As a product manager, Tableau can be a powerful tool for creating a business case for stakeholders like executive management, or even when you are trying to help your sales and marketing teams understand how customers are using the product.
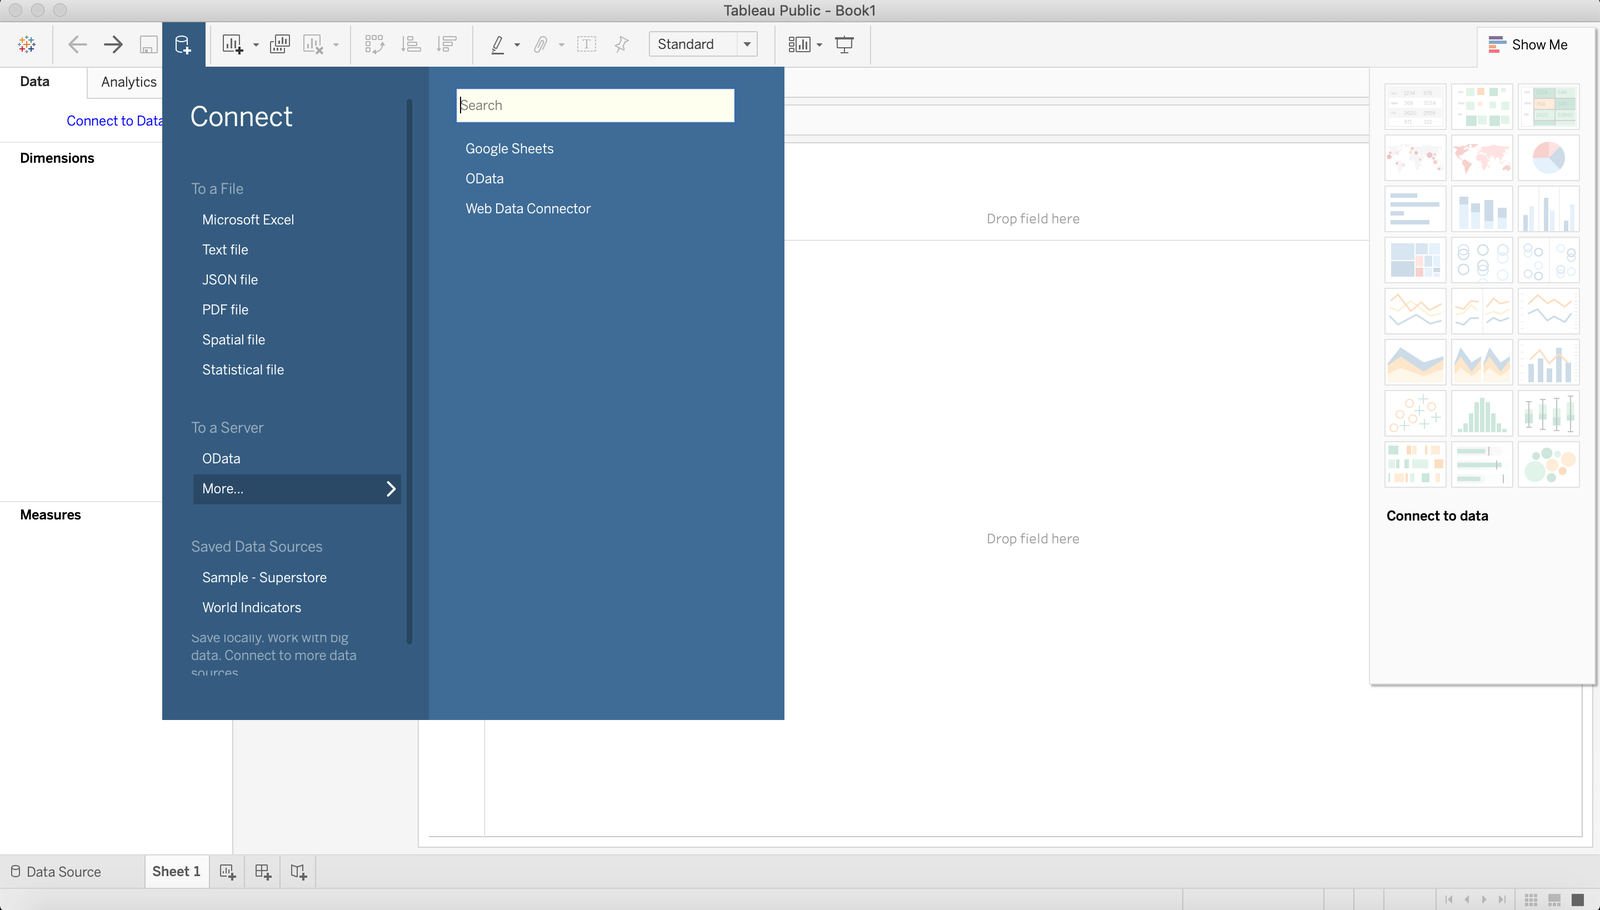
Data sources
Data sources can be any form of data that you can pull into Tableau to create workbooks and dashboards. Tableau is extremely flexible in the type of data it will accept. The data sources accepted by Tableau include text files, MS Excel files, CSV files, PDF files, JSON Spatial files, Statistica files, and information from Google Sheets and database servers.
Static versus dynamic data
Data for analysis can be static or dynamic. For example, if you upload a CSV file into Tableau, that's static data. Any reports you make will stay the same because the data stays the same. However, data from sources like a database or sales tool is dynamic—always changing—so your visualizations should always update based on those changes.
When using a visualization tool, you should learn its rules about how and when it updates data to make sure you're always getting the right information. You'll be using static data for the exercises in this module, but keep this in mind when doing your own analysis.
Where to find the data you care about
Simply put, you should look at every tool used by other teams in your organization to find insights into your users and products. For example, your sales and marketing teams use multiple tools to track and connect to potential users of your product. These touchpoints might provide important insights, like what path users followed that ended in a successful (or unsuccessful) conversion, certain ad campaigns that are more effective than others, or insights into your retention rates based on sales activities.
Data from analytics tools like Google Analytics, sales tools like Salesforce, and marketing tools like Mailchimp or Hubspot can all be pulled into Tableau. There, you can analyze the data for trends or insights that will inform you about what's really happening with your product. For example, it might be important for you to track customers from an email marketing campaign through to their onboarding or purchase of your product. If your marketing team is running a campaign for re-engagement with your product, then it will be critical to track users from the email marketing campaign to their usage of your platform. The strength of Tableau is its ability to unite these different sources of data to help you gain a better understanding of your customer.
Practice ✍️
Now that you have a high-level sense of what Tableau is all about, it's time to download and install the application. For the purposes of this program, you should use the desktop version of Tableau Public. This version is free, and it will allow you to produce assets that you can easily share with your network at PMcademy as well as with potential employers.
It's important to note that the underlying data and any assets you create with Tableau Public will be publicly viewable. Under no circumstances should you use proprietary or otherwise sensitive data in Tableau Public. Again, the data and assets you create with Tableau Public will be publicly accessible, so act responsibly!
Now, head over to the download page for Tableau Public. Find the version that's right for your system, download it, and install it. Follow the instructions from Tableau's website. When you are all set with Tableau Public.