21.3 Connecting Data Sources ⭐
This section includes a mandatory Assignment ⭐
As you learned in the last checkpoint, Tableau connects to all kinds of data. Got an Excel file? It'll import it! Got a CSV file? It can import that too! All data used in Tableau comes from somewhere else. To access this data in Tableau, you'll have to connect to it. In this checkpoint, you'll learn how to connect Tableau to common data sources.
By the end of this checkpoint, you should have learned the following:
- How to complete the basic Tableau tasks of creating workbooks, connecting datasets, and filtering datasets

Cleaning and connecting data
Any raw dataset will have inaccuracies and inconsistencies created by data entry errors, by file corruption in transmission or storage, or by differences in the data formats between systems. The process of identifying and removing these inconsistencies is known as cleaning the data. After it's cleaned, a dataset should be consistent with other similar datasets in the same system.
What does this have to do with using Tableau? You'll remember from the last checkpoint that you will want Tableau to utilize product, sales, and marketing data to gain insights. This data will come from a number of different tools, each with their own data formats. Before you can do anything with that data, you'll need to wrangle it into a usable form.
Often, this is a challenging task. Data professionals spend a lot of their time just preparing data. As a product manager in a large organization, you may have data professionals to collaborate with who can wrangle the data for you. In medium or small organizations, and especially in startups, this work will be heavily dependent on you as the product manager.
Fortunately, Tableau can help with this data preparation process! Get started by connecting data in Tableau. Go ahead and open Tableau Public. You should see an initial screen that looks similar to the screenshot below:
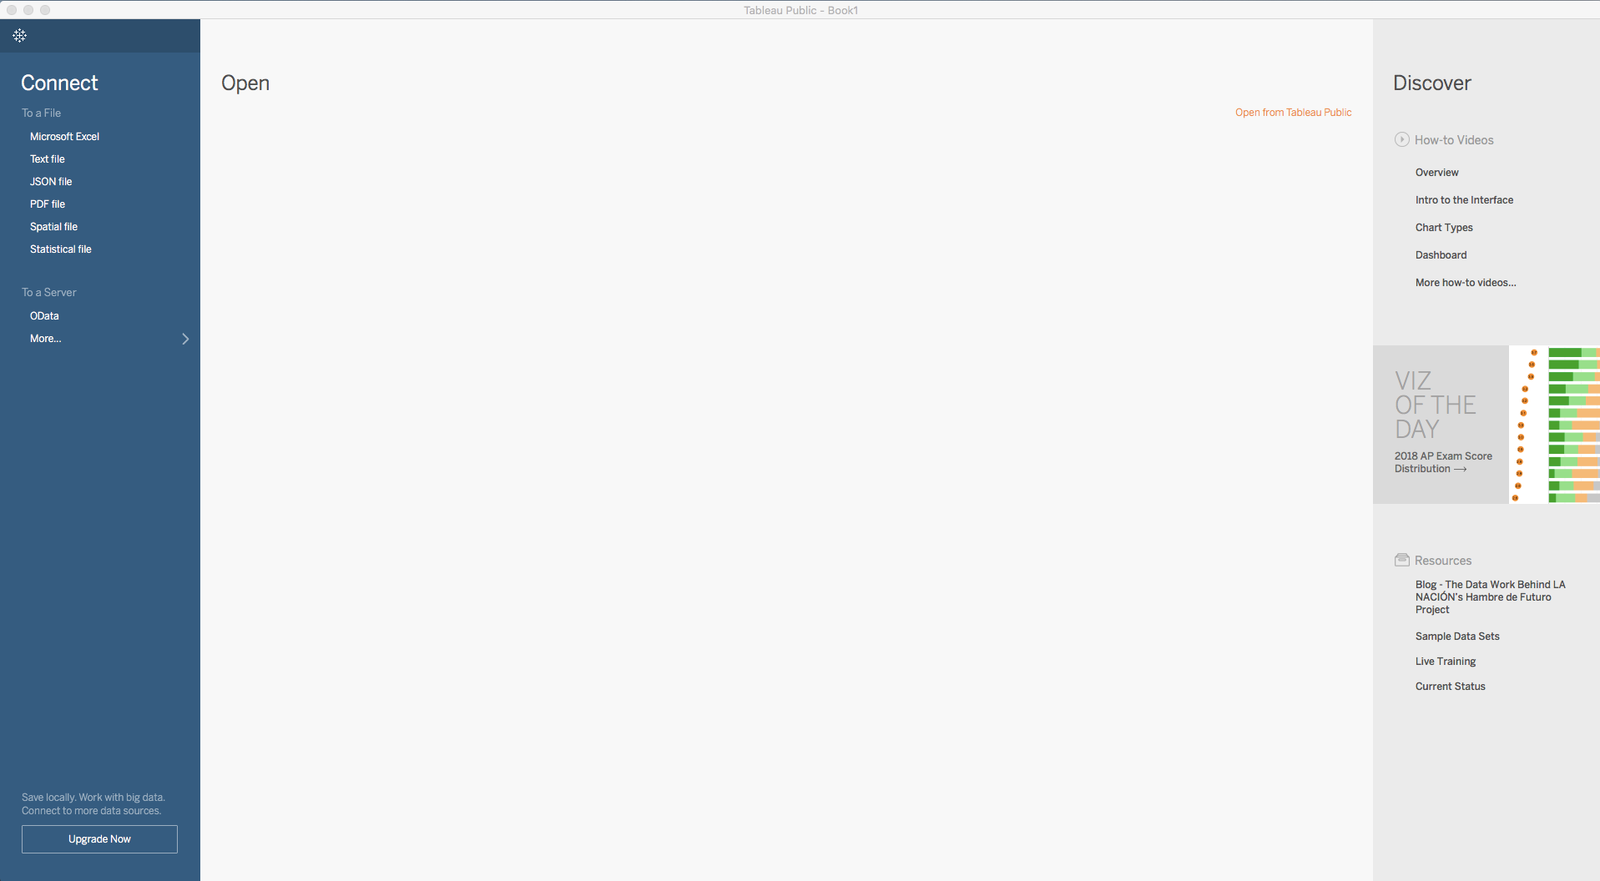
On the left-hand side of the interface, you'll see a list of connection types that are available to you in Tableau Public. This checkpoint will focus on CSV and Excel data. Such a focus might be reflective of your experience if you end up working in a small startup where the free version of Tableau Public might be your only tool to do research limited to such static data sources. But if you work for a larger organization, you'll probably use paid versions of Tableau, which can also connect to live data sources like a relational database.
A note on datasets
For the checkpoints in this module, you'll be using two of the sample datasets offered by Tableau: the Superstore dataset and the World Indicators dataset. The Superstore dataset contains order-level data from a superstore that sells technology, furniture, and office supplies. The World Indicators dataset contains information on development, health, and population rates by world countries. You'll also use a dataset containing historic Olympic Games data, called Olympic History, for additional practice.
These datasets are specially crafted to help you learn how to use Tableau. They might not mimic the data you will eventually analyze as a product manager. As a PM, the data you encounter will depend a lot on the product you work on and the analytics your product collects. For example, that data might include web or mobile page views, specific events that your users complete, products and transactions for e-commerce apps, or user engagement for SaaS apps. Nonetheless, the data analysis processes and skills you use will remain the same.
Understanding the connection page
Begin by connecting to the Superstore dataset. First, download this Excel workbook, which contains a copy of the Tableau Superstore dataset. Then start Tableau Public.
On the main screen, which should look like the image below, click Connect > Microsoft Excel. Navigate to your saved Superstore dataset:
You should now see a blank page, as shown below. This is called the Data connection page. You may also see this page referred to as the Connect page or the Connections page.
A Tableau workbook is like an Excel workbook in that it consists of several worksheets. Like in Excel, you can navigate between worksheets via tabs at the bottom of the window. From these tabs, you can see that you're on a special first page: Data Source.
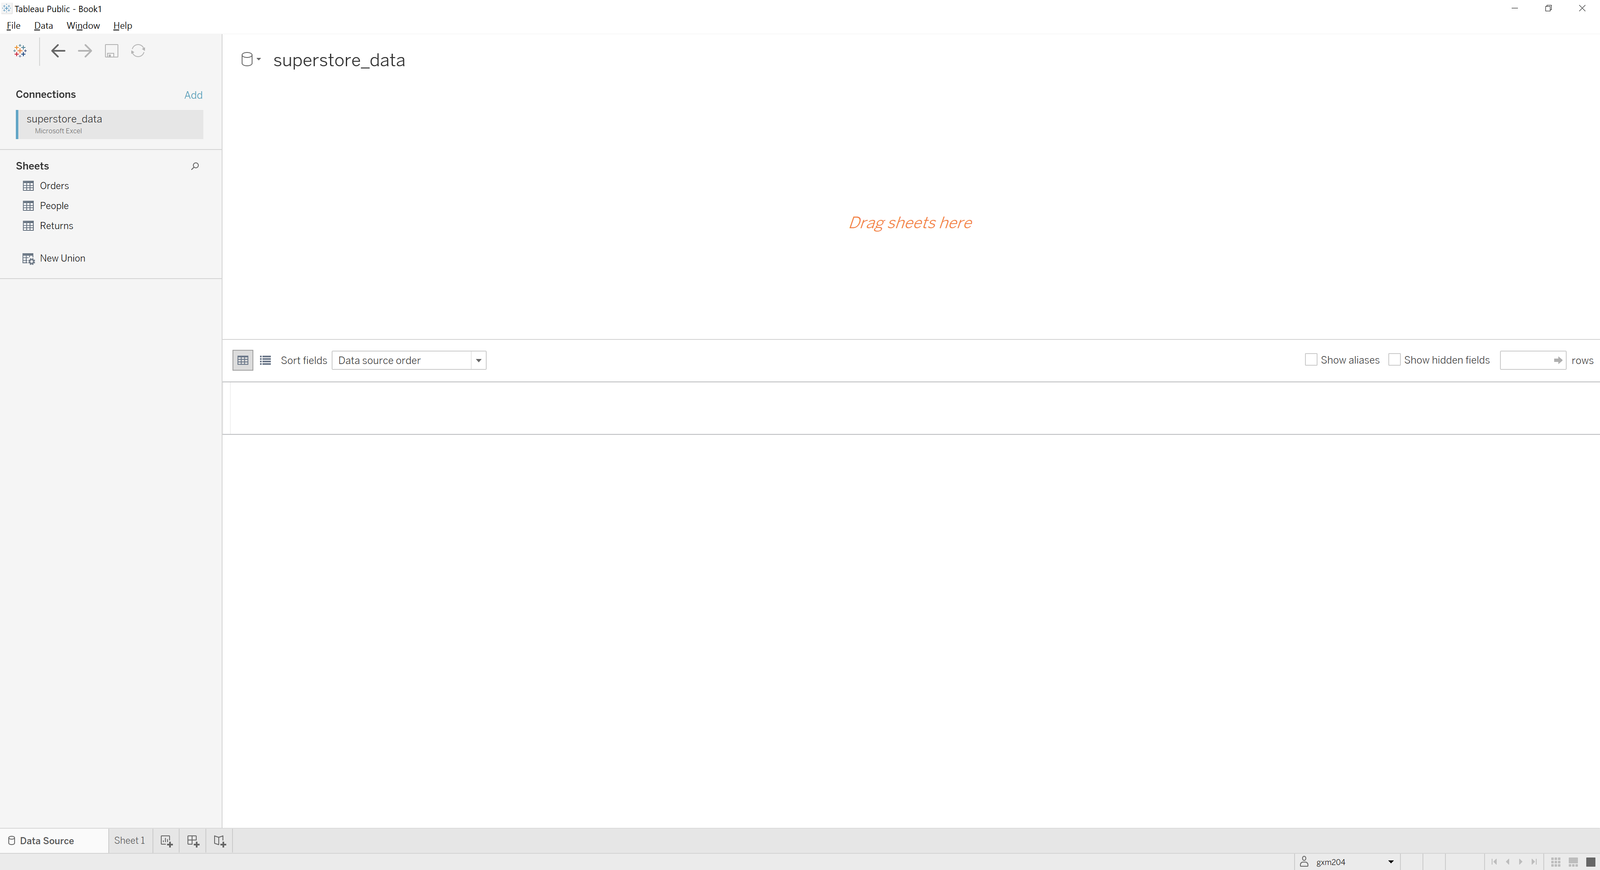
In Tableau, this page provides a visual interface for connecting to data and joining tables. It also centralizes other tools for analyzing the contents of the data. You'll use this page to connect to and manage your data inputs. Looking at the left pane of the worksheet, you can see that your current connection is to the superstore_data Excel workbook. Underneath that, you can see that Tableau has located the three individual sheets in this workbook. You can now use Tableau's visual interface to load, join, and manipulate these tables.
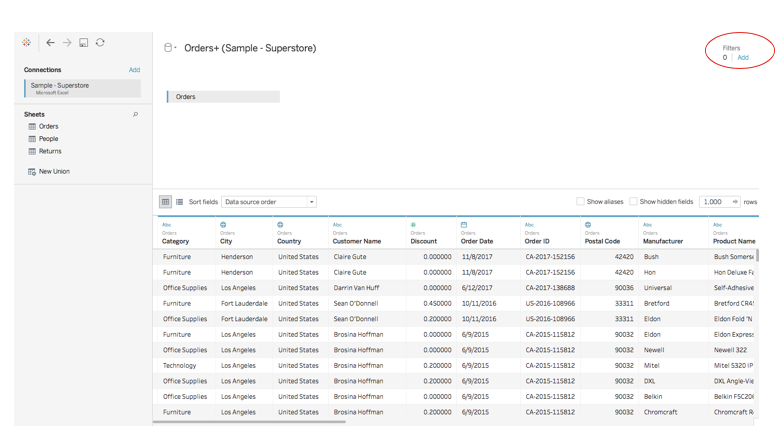
Drag the Orders sheet to the blank space labeled Drag sheets here. You'll see data automatically generate in the preview area, as shown below:
You will eventually do the same procedure to join People and Returns, but first you should focus on understanding the various sections of the connection page.
The left pane
The left pane provides an overview of the data sources available in this workbook. Next, you should explore this area a bit further. The top of this pane lists all current data connections. And right now, you're connected to one source: superstore_data. You can rename this connection by double-clicking on the current name. For practice, rename this connection Superstore Data.
The next section of the left pane is called the Sheets area. It contains the names of the individual worksheets from our workbook data source. If your data source were, for example, a database, then you'd get a list called Tables that contained all the tables in this database.
As you can see, the three worksheets in your Superstore workbook are labelled Orders, People, and Returns. Hover over any of these worksheets, and you'll see a View Data icon, which looks like this:

If you click on this icon, you'll see a new window containing a preview of this table, as seen below:
Why does Tableau have a preview area when you can just drag it into the worksheet like you already did? What's the point? This distinction will come in handy when you begin to join datasets. By using View Data, you can preview data tables before deciding how to join them.
Data source filters
After you connect to a data source, Tableau makes it easy to filter this source data before you begin to analyze it. You should see the word Filters at the upper right of your workbook, with the number 0 underneath it. The 0 indicates that you currently don't have any filters on this data source:
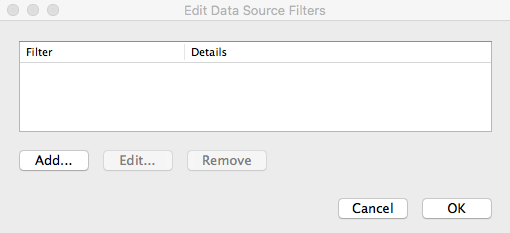
Next, add a filter. Click the Add button next to the number 0. This will bring up an Edit Data Source Filters table. Here, you can add, edit, and remove data source filters:
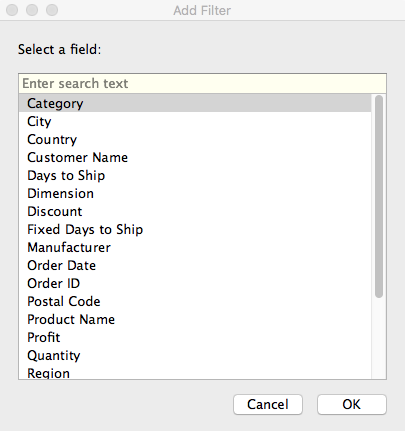
Select Add. This will offer you a list of all the fields in your data table that you could filter by, as shown below. Say that you only want to include orders from the past three years. You can filter the source data to include only this date range by selecting Order Date from the menu.
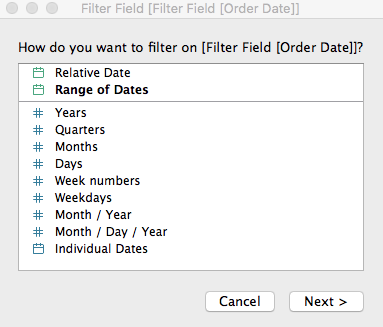
After selecting Order Date, you'll see even more options for filtering this field. You could filter by year, quarter, month, and so forth. You're interested in filtering by the last three years, so select Years:
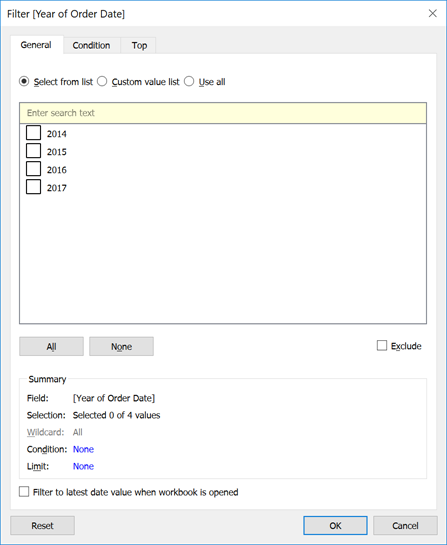
Next, you'll see the menu shown below. In this menu, you can filter the data source by various years by clicking the checkbox for each year you want to include. For now, don't filter by a date range; instead, you'll leave this data source as is. Click out of the menus and return to the main Data connection page.
Data source filters are helpful when you're interested in only a subset of your raw data and don't need any data from outside that subset. Keep in mind that it's also possible to filter data from within an individual Tableau workbook. Data source filters are a more universal workbook setting, which has its advantages and disadvantages.
Preview area
The Preview area is at the bottom half of the page. This displays the rows and columns of sheets placed in the Join area, which is the area in the top half of the page where you previously dragged the Orders sheet. Next, you can see what's possible in the Preview area.
Renaming a field
As you've seen, you can rename a connection. But you can also rename an individual field in Tableau. To do this, double-click on the current name in the Preview area. Rename the Postal Code field to Zip Code:
Hiding a field
Just like using a data source filter, you can also hide any fields that you don't plan to use in the workbook. For example, you can hide the Country field because all the records in this dataset are from the United States. To do this, click the drop-down menu on the item label and select Hide:
Manage metadata
There are two small icons at the top left corner of the Preview area. Take a moment to explore them. Hovering over these two buttons, you can see that they're named Preview data source and Manage metadata, respectively. The Preview data source button gives us a tabular look at our dataset. Now, you can toggle over to the Manage metadata view:
Here, you get a smaller table listing information about each field in your table:
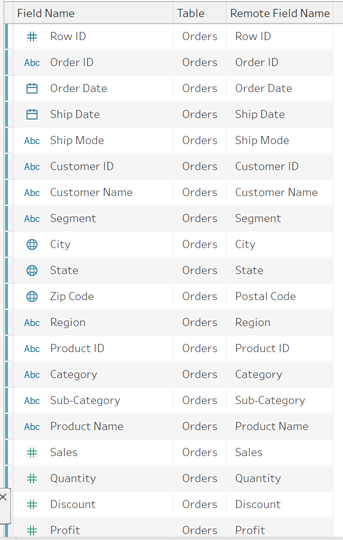
Take a look at your Zip Code field. This is the field you renamed from Postal Code. Although the field name is set to Zip Code, the remote field name remains Postal Code. In Tableau, the remote field name is the name of the field in the original, or remote, data source. At the moment, this metadata table does not include our Country field because you hid it. You can bring that field into this list by checking the Show hidden fields checkbox on the upper left of the Preview area. Country will now appear in this table, shaded gray, as seen below:
Changing the data type
Now you can toggle back to the Preview data source view of this workbook. Each field name has the word Orders above it, making it clear that the variable is from the Orders table. This will become useful as you join in other datasets. Also, notice that there is an Abc at the top of the order ID column. This means that the variable is a string. Try clicking on the Abc to open its drop-down menu.
This menu lets you change the data type for anything that Tableau reads incorrectly. You can also change the data type later on when you actually start building out charts.
Notice that Tableau correctly reads Order Date and Ship Date as dates. It also correctly identifies geographical properties. Most of the time, Tableau will automatically set the data type as you would intend it to. There will be few occasions in which you'll need to manually change the data type.
Joining other tables
Joining tables in Tableau is useful when you have data from multiple sources. As discussed earlier, Tableau's strength is in its ability to combine multiple data sources, like Google Analytics, Salesforce, and marketing data to provide a view of your customer as they interact with your product and other parts of your company.
Joins in Tableau work a lot like joins in SQL. Drag the People table next to the Orders table. You'll see that Tableau automatically joins the two tables as an inner join. Unless you specify otherwise, Tableau will assume that you're interested only in the subset of data that is present in both of these datasets. Now you'll want to make sure that you didn't lose any orders due to missing data in the People table. To do this, click the circles and change the join to a left join, as shown below:
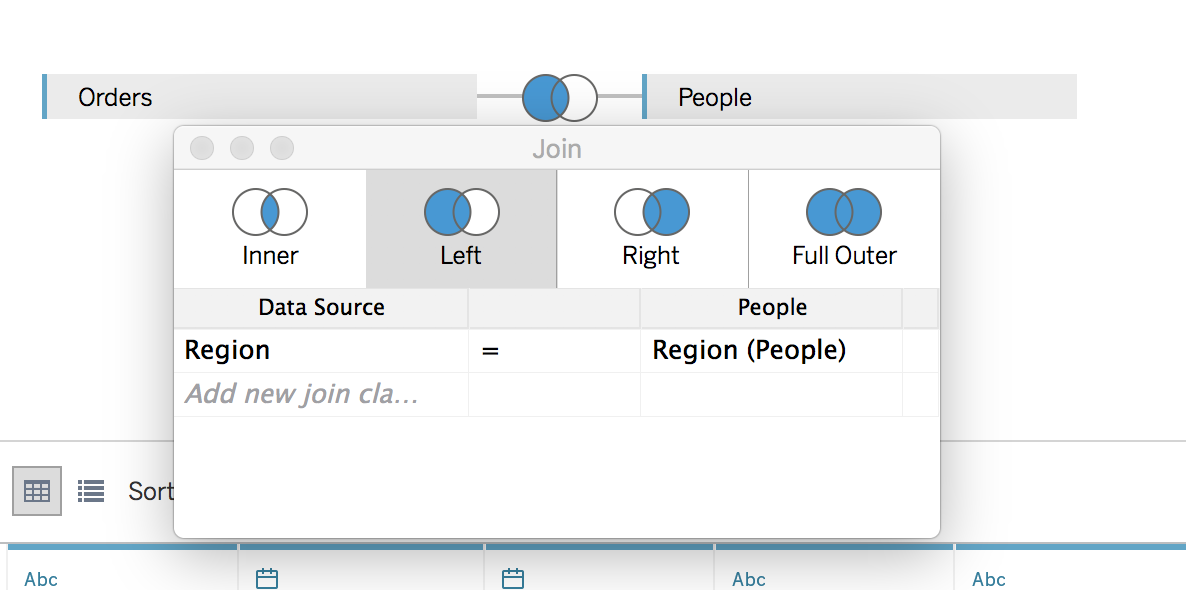
You'll notice that Tableau automatically selected a join clause with Region as the key. You can change the key at any time by clicking on the word Region and selecting a different field in the table. Just like you would do in SQL, you should make sure that your unique key is present in both tables. In your organization the unique key might be a customer's email address used in a marketing campaign or an account ID within your product.
Do the same for Returns. Tableau will auto join Orders to Returns through an inner join. Returns will only contain orders that have been returned, so we need to change this to a left join as well. Scroll to the right, and find the data columns for the Returns table. You'll see that most of the data is null, meaning that there wasn't a record for the Order ID in the Returns table. This just means that the specific order was not returned.

Saving workbooks on Tableau Public
Remember: when you work with Tableau Public, all of your work gets stored in the cloud. This means that it will be publicly accessible. It also means that your files are not stored locally on your computer. Tableau Public requires at least one visualization to save a workbook. Now, you can create a quick first visualization so that you can save what you've done so far. This visualization will become your starting point for the next checkpoint. Follow the steps below:
- In the Data Source tab, look at the bottom left-hand corner of the interface. Click Sheet 1.
- In the left pane, find Dimensions > Orders. Click and drag Region into the Columns shelf, which is near the top of the window.
- Now, return to the left pane. Click and drag Number of Records from the Measures pane into the Rows shelf, which is just below where you placed the Region column.
- Voila! You've created your first visualization in Tableau. This should be a bar chart of the quantity of records for each region in our dataset. We'll examine visualizations in more depth in the next checkpoint, so you can get on to saving your work.
- To save, you have two options. You can click the Save icon in the toolbar. Or, from the menu bar, you can select File > Save to Tableau Public As. You might be prompted to sign into Tableau Public. Next, choose a name for your new workbook. For example, you could save it as PMcademy Superstore.
- Click the Save button. It might take a few seconds, but then your workbook will be uploaded to Tableau Public. When it's been uploaded, you should automatically be taken to a new browser window. This will be the URL of your Tableau Public workbook. The URL you see there can be shared with others so they can see your work.
Now that you know how to save and share your workbooks to Tableau Public, you're ready to begin developing in Tableau! In the next checkpoint, you will be introduced to the Tableau interface and begin building visualizations.
Assignment 14 ⭐
The assignment for this checkpoint is to create two new Tableau workbooks and to save them on Tableau Public. You will use the Tableau workbooks you create here in future checkpoints.
World Indicators Data
- Download this Excel workbook, which contains a copy of the Tableau World Indicators dataset. This dataset features per-country stats on information like birth rate, energy consumption, etc.
- Create a new Tableau workbook by connecting to this data source.
- Quickly create a visualization in the Sheet 1 tab so you can save your workbook.
- Save your workbook to Tableau Public with a descriptive name.
- Copy the link to your workbook. You'll submit this link, along with the one to the next workbook, at the bottom of this checkpoint.
Olympic History Data
- Download this Excel workbook, which contains historical data on the Olympics. It has variables such as game, team, and medal type.
- Create a new Tableau workbook by connecting to this data source. In the preview area, do the following:
- Rename your dataset Olympic History.
- Convert Year to be a date.
- Convert Weight to be a numeric (whole) data type, like the integer data type you learned about in the How databases work checkpoint.
- Convert NOC to have the geographic role of Country.
- Hide the field Games.
- Quickly create a visualization in the Sheet 1 tab so you can save your workbook.
- Save your workbook to Tableau Public with a descriptive name.
- Copy the link to your workbook. You'll submit this link, along with the previous one, at the bottom of this checkpoint.
After completing these steps, you should have three separate workbooks: one connected to the Superstore data, one connected to the Olympic History data, and one connected to the World Indicators data. Make sure all three of these workbooks are saved to Tableau Public before you move on. To complete the checkpoint, submit a link to each of your Tableau Public workbooks below.
Submission
Submit your links in the slack channel #assignment-14